Find information on how to make a Protected Disclosure under the external procedures in place in the HEA.
Find information on how to make a Protected Disclosure under the external procedures in place in the HEA.

INSPIRE is a €750 million investment package that will address research infrastructure needs across the higher education sector while ensuring alignment with national research and innovation priorities.

Tracking graduate outcomes is crucial to improving the quality of education for students and outcomes for graduates.
1. Demographics
This chapter examines new entrant respondents to the EAS with a disability by:
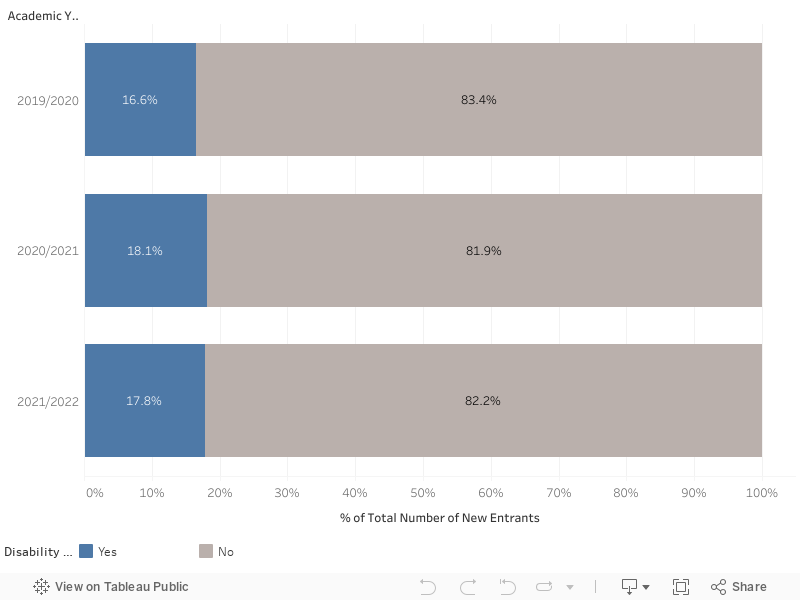
17.8% of new entrants state they have a disability
A total of 6,035 new entrants state they have a disability in 2021/22 – 17.8% of the total number of EAS respondents. This is down from 18.1% in 2020/21, and up from 16.6% in 2019/20.
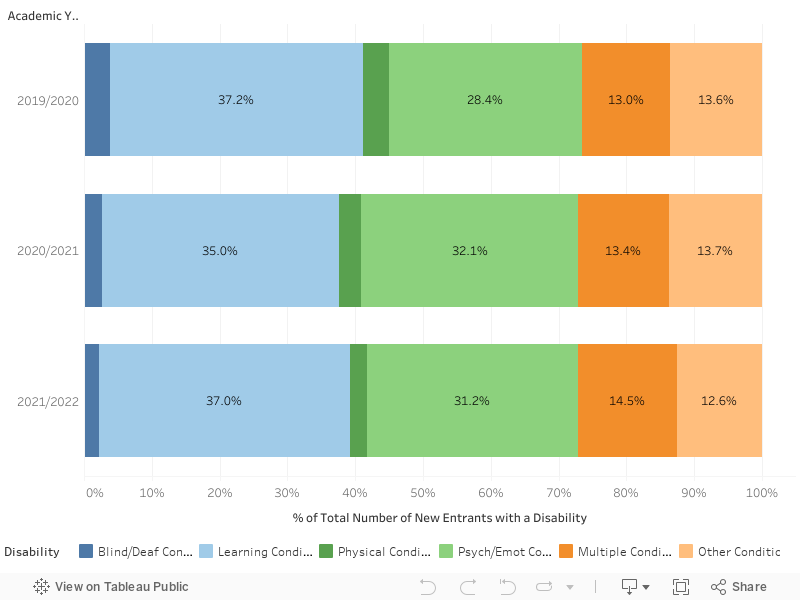
The most common disability is Learning Conditions at 37%
Figure 3 shows the percentage of new entrants who state they have a disability by the type of disability. Learning Conditions (37.0%) and Psychological / Emotional Conditions (31.2%) are the two most common disabilities reported by new entrants.
Approximately 14.5% state they have multiple conditions. Of those with multiple conditions, the vast majority have two conditions (86.6% in 2021/22). Nearly all have either two or three conditions (98.7% in 2021/22).
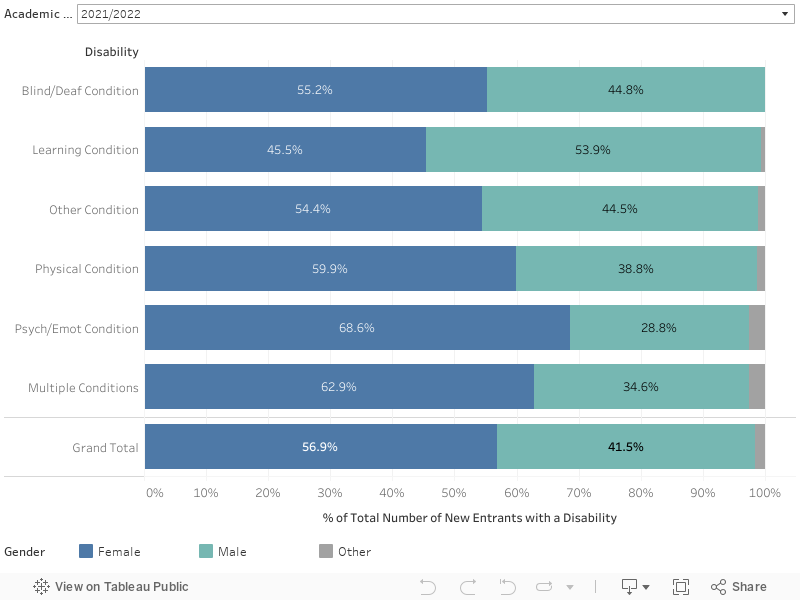
56.9% of new entrants with a disability are female
Overall, 53.1% of new entrants in 2021/22 are female (HEA Key Facts & Figures, 2022). Of those who state they have a disability, 56.9% are female. Figure 4 shows the percentage of new entrants by type of disability and gender. Compared to the average (56.9%), there is a much higher proportion of females amongst those with Psychological / Emotional Conditions (68.6%). Those with Learning Conditions were 53.9% male, whereas in all other categories women outnumbered men.
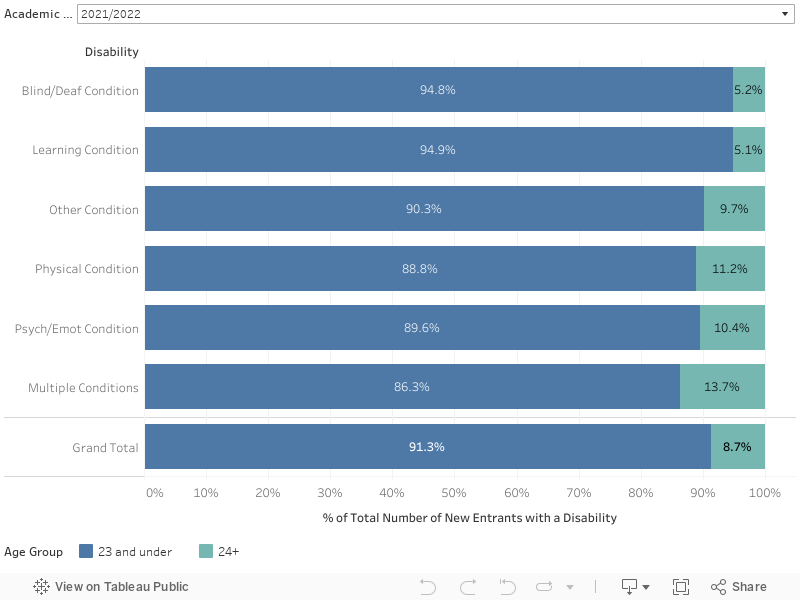
8.7% of new entrants with a disability are mature students
Overall, 6.6% of new entrants are mature students aged 24+ in 2021/22 (HEA Key Facts & Figures, 2022). Figure 5 shows the percentage of new entrants who state they have a disability by type of disability and age group. Compared to the average (8.7%), there is a higher proportion of mature students amongst those with Multiple Conditions (13.7%), and those with Physical Conditions (11.2%).
The following analyses relates to Irish-domiciled students only.
Wicklow has the highest rate of new entrants with a disability
Overall, 17.8% of new entrants in 2021/22 state they have a disability. Figure 6 shows the percentage of new entrants who state they have a disability by home county. Wicklow has the highest rate of new entrants with a disability. The lowest rates are in Cavan (12.1%), and Limerick (13.0%).
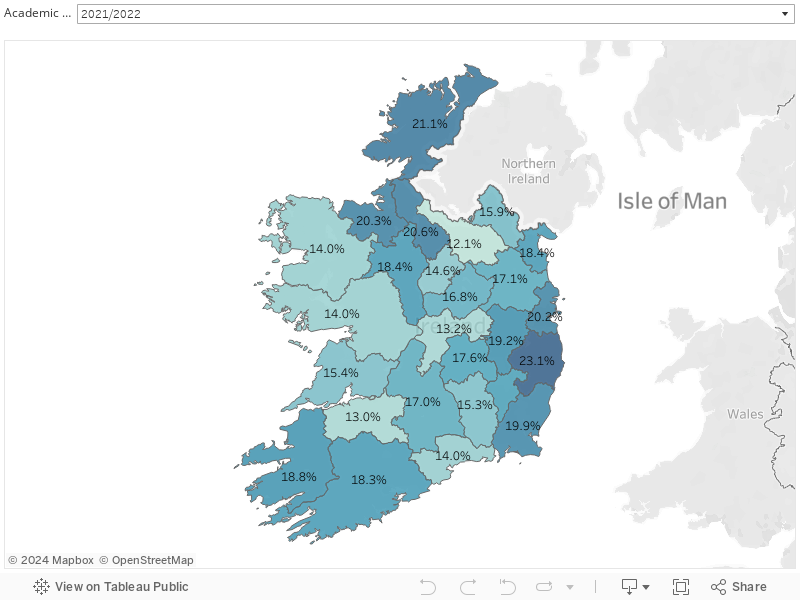
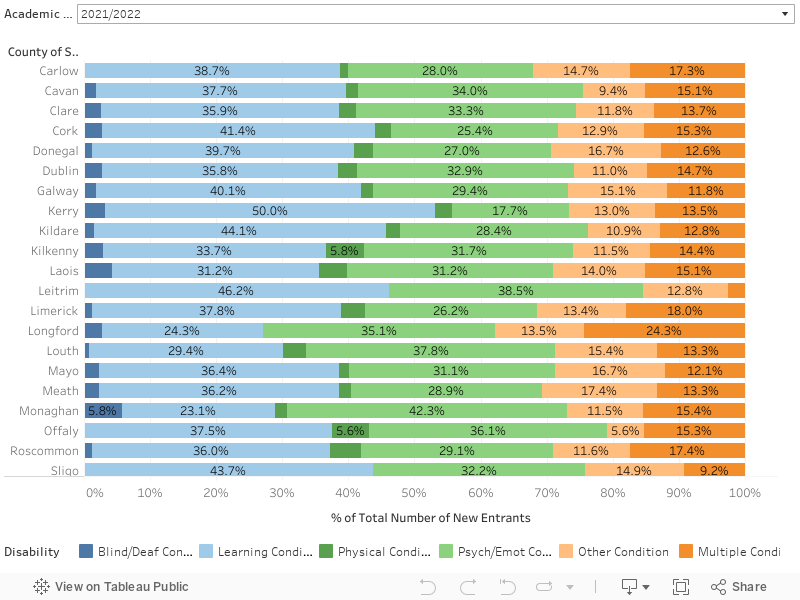
A further breakdown by type of disability is presented in Figure 7 below.
The following analyses relates to Irish-domiciled students in 2020/21 only.
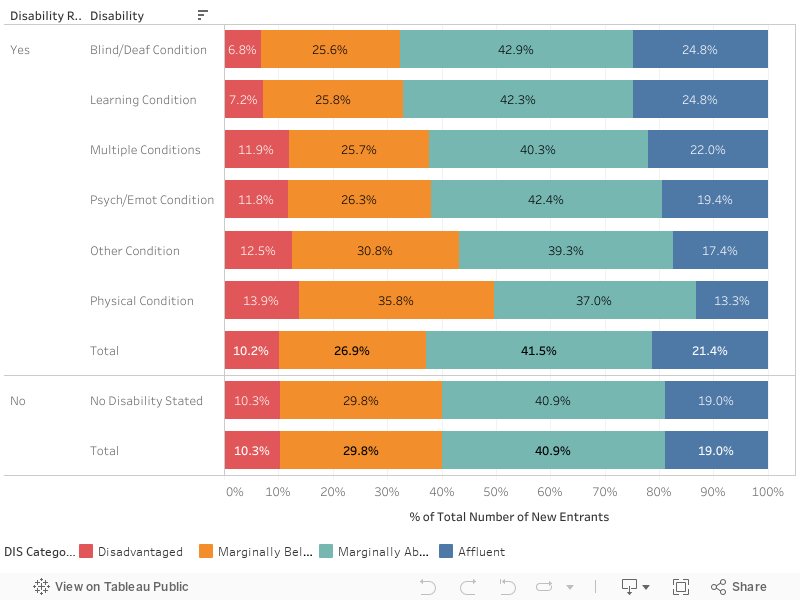
10.2% of new entrants with a disability come from disadvantaged areas
Of all new entrants in 2020/21, 10% come from disadvantaged areas, 29% come from marginally below average areas, 42% come from marginally above average areas, and 20% come from affluent areas (HEA Socio-Economic Profiles 2020/21). Figure 8 shows the percentage of new entrants by socio-economic background.
Of the new entrants who state they have a disability, 10.2% come from disadvantaged areas (versus 10.3% of those who state they do not have a disability), while 21.4% come from affluent areas (versus 19.0% of those who state they do not have a disability).
Socio-economic differences exist between new entrants with different types of disability. Those with a Physical Condition are more likely to be disadvantaged, where 13.9% are coming from disadvantaged areas. Meanwhile, those with a Blind / Deaf Condition are less likely to be coming from disadvantaged areas, with 6.8% of these students coming from disadvantaged areas. Note that this relates to the new entrants who are in higher education only.