
Find information on how to make a Protected Disclosure under the external procedures in place in the HEA.
Find information on how to make a Protected Disclosure under the external procedures in place in the HEA.

INSPIRE is a €750 million investment package that will address research infrastructure needs across the higher education sector while ensuring alignment with national research and innovation priorities.

Tracking graduate outcomes is crucial to improving the quality of education for students and outcomes for graduates.
2. Student Profile
This chapter explores the socio-economic profile of higher education students by the following characteristics:
How affluent or deprived is the area you live in?
The Deprivation Index Score measures the relative affluence or deprivation of a particular geographical area. This uses data from the 2016 Census, and is measured right down to street level, based on small-area statistics (on average, 80-100 households).
Thus, showing the extent to which every neighbourhood, suburb, and village is affluent or deprived. Ten key indicators are included in this measure (e.g., the proportion of skilled professionals, employment levels, education levels).
More information on Deprivation Index Scores can be found here.
Note: Deprivation Index Scores range from a scale of approximately -40 (most disadvantaged) to +40 (most affluent). The lower the score, the more deprived; the higher the score, the more affluent.
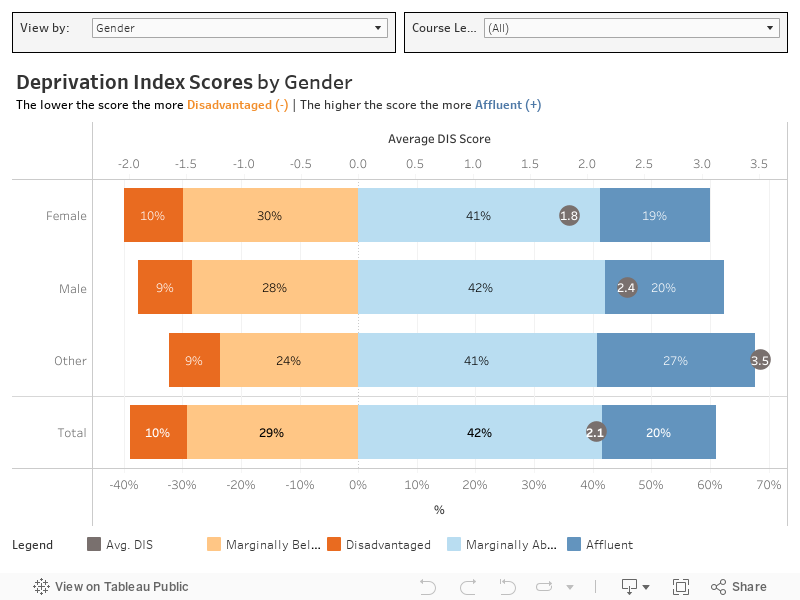
Key Finding: The average DIS for the Irish higher education population is 2.1. Approximately 1 in 10 are Disadvantaged, while 1 in 5 are Affluent. Approximately 71% of students lie somewhere in between – 29% are Marginally Below Average, and 42% are Marginally Above Average.
Overall: For Undergraduate students, the average DIS is 1.7. This is relatively deprived compared to the total average of 2.1 (Undergraduates and Postgraduates combined). One in ten are Disadvantaged, 30% are Marginally Below Average, 41% are Marginally Above Average, and 18% are Affluent.
Gender: Students who identify as Non-Binary or Undeclared (comprising Other) are relatively affluent (DIS = 3.5). More than one in four of these students are affluent (26%). Students who identify as Female are relatively deprived (DIS = 1.4) compared to Males (DIS = 2.0).
Age: Mature students (aged 24 and over) on undergraduate courses are more deprived (DIS = 1.2) than students aged 23 and under (DIS = 1.8).
New Entrant: Deprivation Index Scores did not differ hugely for New Entrants (DIS = 1.4) and all other Undergraduates (DIS = 1.8).
Mode of Study: Both Full-Time students and Part-Time students have a DIS of 1.7.
Overall: Postgraduate students tend to be more affluent (DIS = 3.8) than Undergraduates (DIS = 1.7). One in four Postgraduate students in Ireland are affluent, and 43% are Marginally Above Average. One in four are Marginally Below Average, and 7% are Disadvantaged.
Gender: Similar to Undergraduates, Males tend to be more affluent (DIS = 4.2) than Females (DIS = 3.6).
Age: Students aged 24 and over are more affluent (DIS = 4.0) than students aged 23 and under (DIS = 2.9). This is in contrast to what was is observed amongst Undergraduate students.
Mode of Study: For Undergraduates, there was no difference in DIS for Full-Time and Part-Time students. However, for Postgraduate students, those studying Part-Time tend to be more affluent (DIS = 4.3) than Full-Time students (DIS = 3.4).
Key Finding: Approximately 82% of students are Undergraduate students, while 18% are Postgraduate students. A much higher proportion of Affluent students are studying Postgraduate courses (24%) than Disadvantaged students (13%).
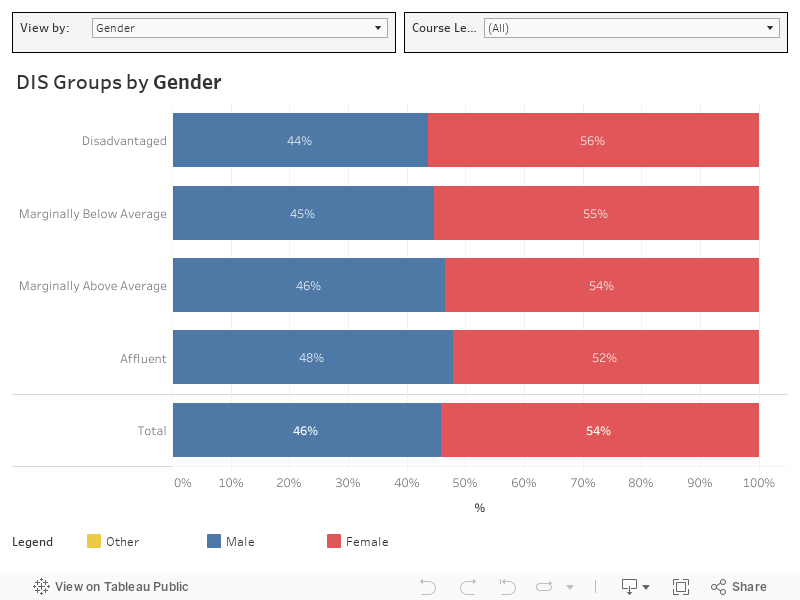
Gender: Female students make up a higher proportion of more deprived cohorts – 56% of Disadvantaged students are Female, compared to 50% of Affluent students.
Age: While 27% of Disadvantaged Undergraduates are Mature students (aged 24 and over), only 22% of Affluent Undergraduates are Mature students.
New Entrant: There is a slightly higher proportion of Disadvantaged students that are New Entrants (26%) compared to Affluent students (23%).
Mode of Study: Similar to what is observed above, there are no major differences by Mode of Study.
Gender: Similar to Undergraduates, there is a slightly higher proportion of Females in more deprived cohorts than more affluent cohorts – 61% of Disadvantaged students identify as Female, while 57% of Affluent students identify as Female.
Age: Overall, the majority of Postgraduate students are aged over 24 (82%). However, there is a higher proportion of students aged 24 and over amongst those who are Affluent (85%) compared to Disadvantaged (80%).
Mode of Study: There is a higher proportion of Affluent students who are studying Part-Time (53%) than Disadvantaged students (45%).
Note: The below relates to New Entrants only – this relates to Undergraduate New Entrants only.
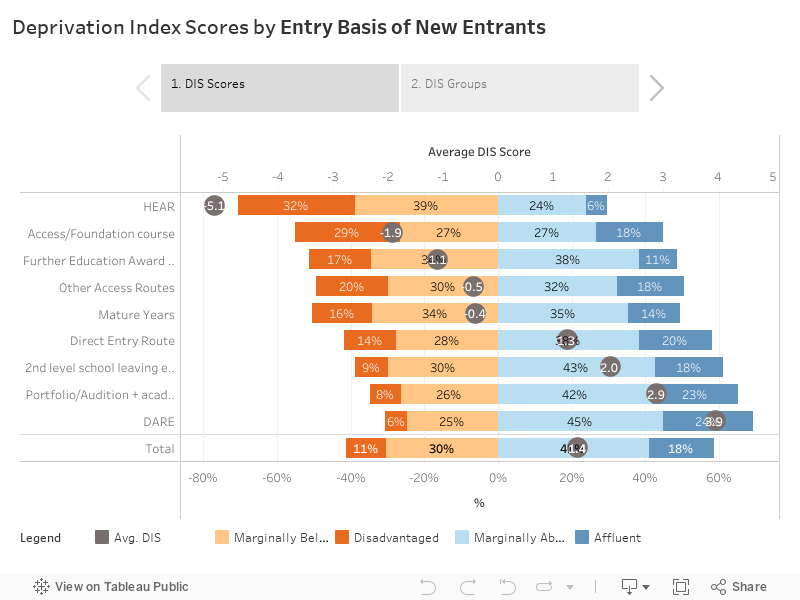
Focusing solely on the Entry Basis of Undergraduate New Entrants, students entering through the HEAR (Higher Education Access Route) scheme are most disadvantaged (DIS = -5.1). Almost 1 in 3 of these students are Disadvantaged, while 39% are Marginally Below Average. Note that the HEAR scheme aims to support students from socially disadvantaged backgrounds. For more information on the HEAR scheme, see here.
Students entering through DARE (Disability Access Route to Education) are most affluent (DIS = 3.9). Almost one in four of these students are Affluent, and 45% are Marginally Above Average. For more information on the DARE scheme, see here.
Approximately 59% of Disadvantaged students enter their Undergraduate programme through second level school leaving exams. Entering through second level school leaving exams is much more common for Affluent students – 3 in 4 Affluent students enter their Undergraduate course via second level school leaving exams.
One in ten Disadvantaged students enter higher education through a Further Education Award or Equivalent, compared to only 4% of Affluent students.
Entering through Mature Years and HEAR is also more common amongst Disadvantaged students than Affluent students.