
Find information on how to make a Protected Disclosure under the external procedures in place in the HEA.
Find information on how to make a Protected Disclosure under the external procedures in place in the HEA.

INSPIRE is a €750 million investment package that will address research infrastructure needs across the higher education sector while ensuring alignment with national research and innovation priorities.

Tracking graduate outcomes is crucial to improving the quality of education for students and outcomes for graduates.
3. Undergraduate Honours Degree Graduates
Undergraduate Honours Degree Graduates: An Honours Bachelor Degree is the most common type of Undergraduate degree. This includes, for example, BA (Hons). These are generally 3-4 years in duration.
Main Graduate Destination
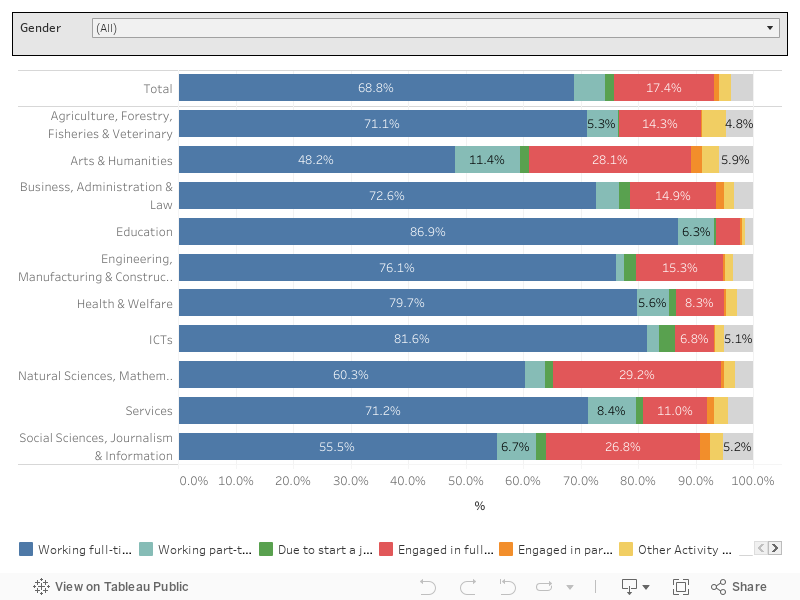
More than three-quarters of graduates are employed nine months after graduation (75.8%), up significantly from 69.7% in 2020, and slightly above 74.7% in 2018.
The proportion of graduates pursuing further study has decreased slightly to 18.3% in 2021, down from 20.9% in 2020.
Unemployment has decreased to 3.9% in 2021, down from 7.2% in 2020. Unemployment decreases are highest in Services (4.7% in 2021; 12.9% in 2020), Arts & Humanities (5.9% in 2021; 12.6% in 2020), and ICTs (5.1% in 2021; 12.6% in 2020).
Unemployment decreased slightly for Social Sciences, Journalism & Information graduates (5.2% in 2021; 6.5% in 2020), and decreased significantly for Engineering, Manufacturing and Construction graduates (3.5% in 2021; 8% in 2020). Meanwhile, unemployment has remained steadily low for Education graduates (1.4% in 2021; 1.4% in 2020).
Employment Outcomes
This section relates only to graduates in employment nine months after graduation (75.8%).
Nine months after graduation, 63.7% of Undergraduate Honours Degree graduates are on permanent or open-ended contracts. Over one in four are on fixed-term contracts (29.2%). Fewer than 1 in 10 graduates are in temporary or unpaid employment (8.1%).
The most common occupation for graduates nine months after graduation is Professional Occupations (49%). Nonetheless, two-fifths (42.1%) of ICT graduates work in Associate Professional & Technical Occupations, and more than 1 in 4 (26.2%) Arts & Humanities graduates work in Professional Occupations.
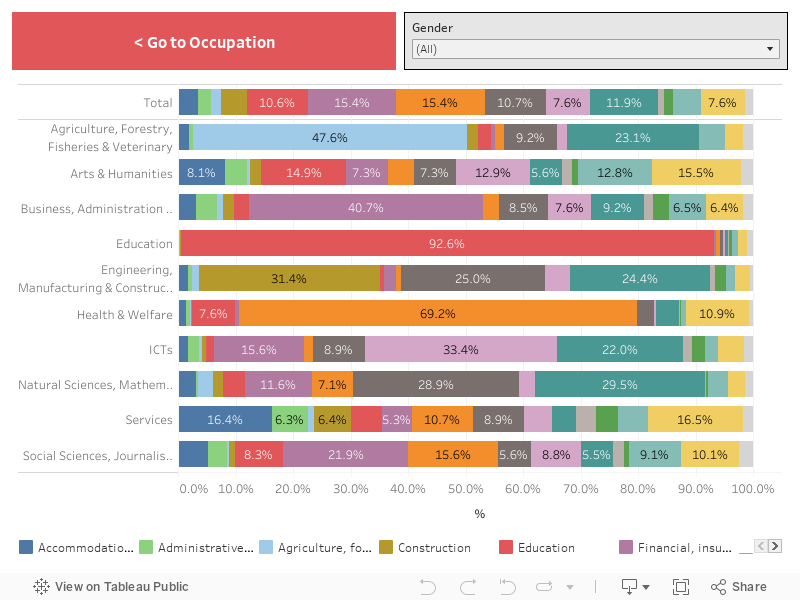
Common sectors of employment include Human Health & Social Work Activities (15.4%), Financial, Insurance & Real Estate Activities (15.4%) and Professional, Scientific and Technical (11.9%). This differs by gender. While 21.9% of female graduates work in Human Health & Social Work Activities, only 7.6% of male graduates work in this sector. Similarly, 14.3% of females work in the Education sector, compared to 6.1% of males.
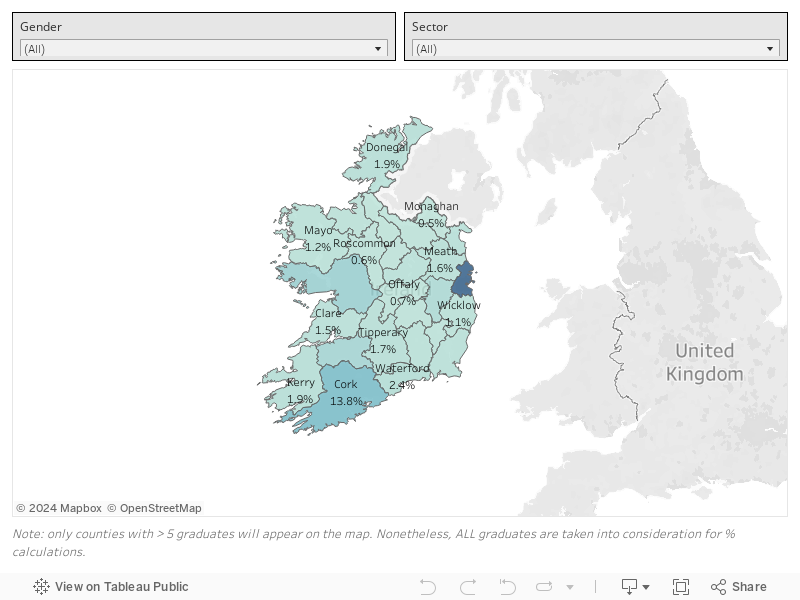
Nine months after graduation, 92.8% of employed graduates are working in Ireland. Dublin is the most common county of employment (43.2%), followed by Cork (13.8%) and Galway (7.1%).
The sectors with the highest proportion of graduates working in Dublin are Financial, Insurance & Real Estate Activities (64.9%), Information & Communication (56.7%) & Human Health and social work activities (42.3%).
Graduates working in the Agriculture, Forestry & Fishing sector are more likely to be working in Cork (21.1%) and Tipperary (8.3%) than Dublin (9.7%).
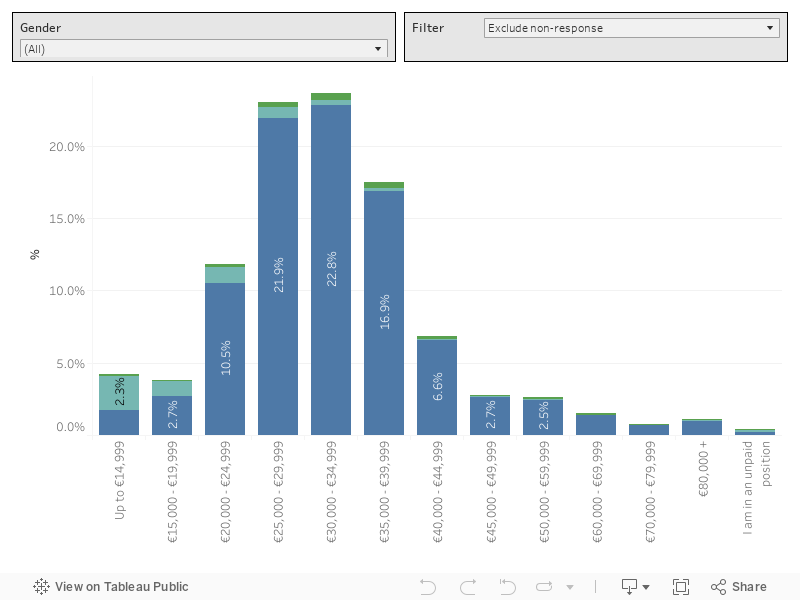
Over one-quarter (27.6%) of graduates do not disclose their salaries. Among those who do disclose their salaries, 50.8% of females are earning between €25,000 to €34,999. This is slightly lower for males, at 41.4%. This gap has widened since 2020 when 46.2% of females earned between these figures and the number of male graduates was 44.7%.
One in five earn less than €25,000 per annum (19.8%), while 33% earn more than €35,000 per annum.
Of the graduates earning less than €14,999 per annum, more than half are graduates in part-time employment.
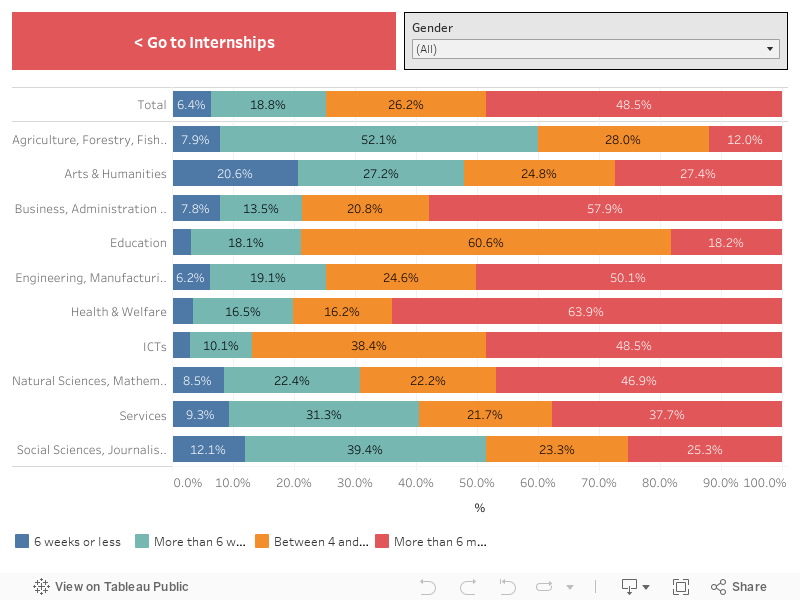
In 2021, 53% of graduates completed internships. This is down from 61.6% in 2020.
The proportion of graduates completing internships varies by field of study. This is particularly low in Arts & Humanities (23.6%) and Social Sciences, Journalism & Information (24.4%). Internships are most common in the fields of Education (94.9%), Health & Welfare (86.6%), and Agriculture, Forestry, Fisheries & Veterinary (69.5%).
Just under half are more than 6 months long (48.5%). Again, this differs by field of study, with Health & Welfare having the highest proportion of internships longer than 6 months long (63.9%). This is followed by Business, Administration & Law (57.9%) and Information & Communication (48.5%).
Arts & Humanities has both a low proportion of graduates completing internships, and moreover, a high proportion of short-term internships, lasting less than 6 weeks long (20.6%).
In the StudentSurvey.ie National Report 2022, students were asked:
“During the current academic year, about how often have you blended academic learning with workplace experience?”
One-third (36.2%) of Undergraduate Final Year students said “Never”, while 28.6% said “Sometimes”. Just over one-third of students (35.3%) said “Often” or “Very Often”.
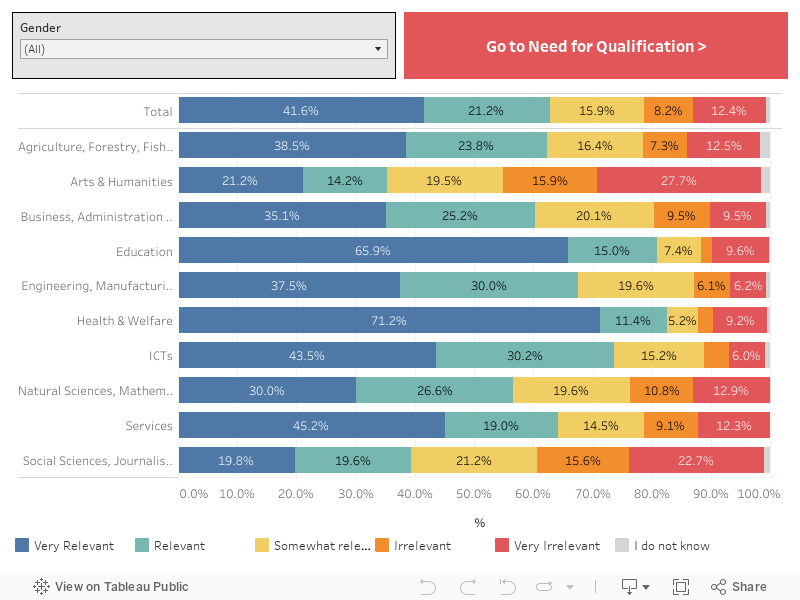
More than six in ten graduates consider their course Very Relevant or Relevant to their job (62.8%). Relevance is highest amongst Education (80.9%) and Health & Welfare graduates (82.7%). In stark contrast, within Arts & Humanities, more than 1 in 4 (27.7%) state that their course is Very Irrelevant to their job. This proportion is similarly high amongst Social Sciences, Journalism and Information graduates (22.7%).
On the need for qualification, 1 in 3 Arts & Humanities graduates state that the qualification is not required for their job (35.8%). A further 9.6% say that they are already in the job. Amongst Education graduates, 89.4% state that their qualification is a formal requirement for their job.
In the StudentSurvey.ie National Report 2022, students were asked:
“During the current academic year, about how often have you talked about career plans with academic staff?”
45.3% of Undergraduate Final Year students said “Never”, 36.4% said “Sometimes”, and only 18.3% said “Often” or “Very Often”.
When asked:
“During the current academic year, how much has your experience at this institution contributed to your knowledge, skills and personal development in the following areas: Acquiring job – or work-related knowledge and skills?”
12.6% of Undergraduate Final Year students said “Very little”, 30.2% said “some”, and 57.1% said “Quite a bit” or “Very Much”.
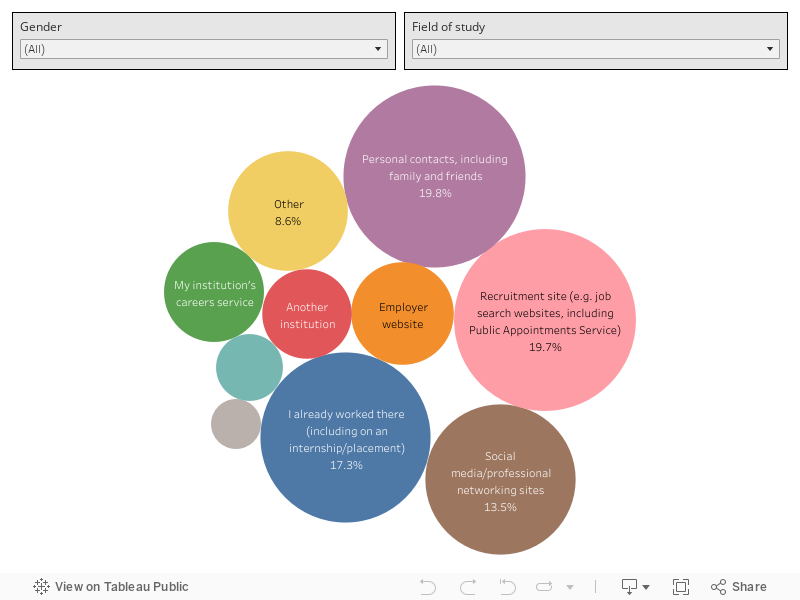
The most common sources of employment include Personal Contacts (19.8%), Recruitment Sites (19.7%), and already working there (17.3%). Over one in ten found jobs through Social Media / Professional Networking Sites (13.5%). The least common sources of employment are Speculative Applications (1.5%) and Media (2.7%).
Services (26.9%), Arts & Humanities (28%) and Agriculture, Forestry, Fisheries & Veterinary (30.5%) graduates have a strong reliance on Personal Contacts for sourcing employment. Amongst Education graduates, Recruitment Sites are a more important source of employment (27.7%) than Personal Contacts (12.9%).
Further Study Outcomes
This section relates only to graduates pursuing further study (18.3%).
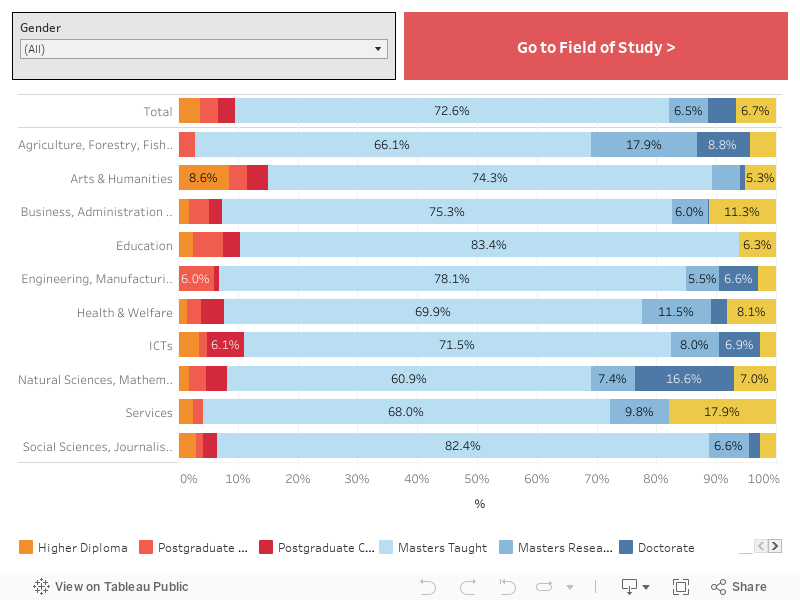
Of Undergraduate Honours Degree graduates who are pursuing further study, 72.6% pursue a Taught Masters. One in six (16.6%) Natural Sciences, Mathematics & Statistics graduates choose to pursue Doctorate programmes.
Most graduates tend to pursue further study in the same field of study. In Business, Administration & Law, 80.7% of graduates pursue further study in the same field of study. Similarly, 81.7% of Engineering, Manufacturing & Construction graduates pursue further study in the same field of study.
In Arts & Humanities, graduates are more likely to pursue further study in Education (35.9%) than in Arts & Humanities (25%).
Business, Administration & Law is a common option amongst graduates of other fields of study – 23.7% of Social Sciences, Journalism & Information graduates, 11% of Services graduates, and 17.6% of ICT graduates pursue further study in Business, Administration & Law.
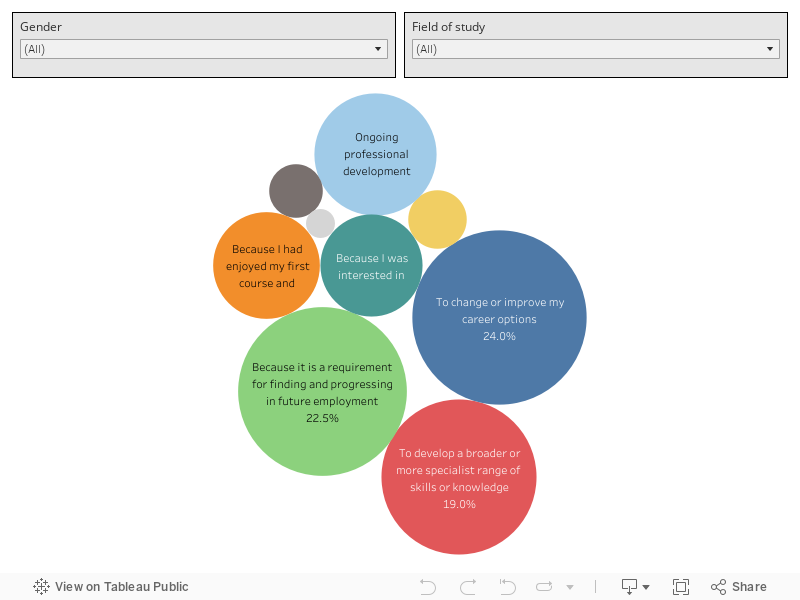
The most common reasons for pursuing further study are to change or improve career options (24%), because it is a requirement for finding and progressing in future employment (22.5%), and to develop a broader or more specialist range of skills or knowledge (19%).
In 2021, only 9% of graduates cited enjoying their first course and wanting to continue study as the reason for further study. In 2020, this was 6.3%.
Engaged in Other Activities or Unemployed
This section relates only to graduates Engaged in Other Activities (2%) or Unemployed (3.9%).
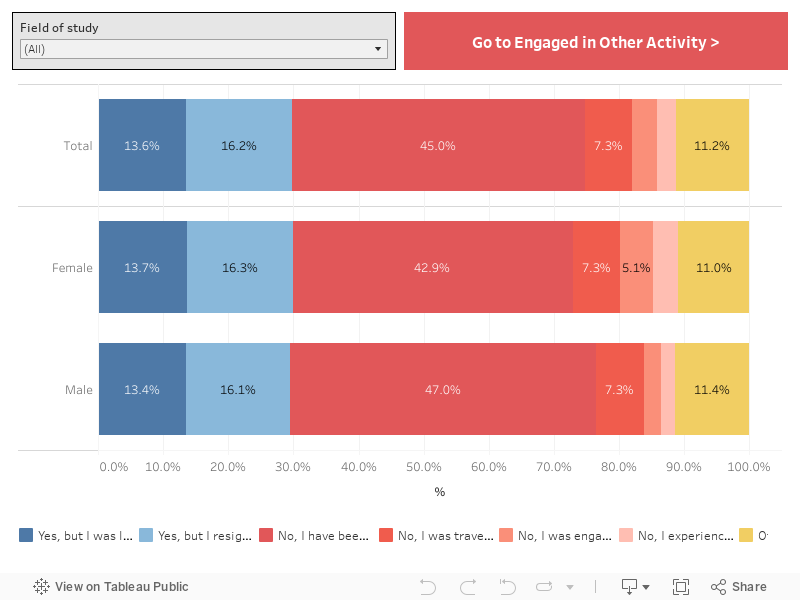
Under half of Unemployed graduates (45%) have been looking for a job since graduation. This is down from 53.9% in 2020 – a 8.9 percentage point decrease. In 2021, fewer than 1 in 6 resigned from their job to seek employment elsewhere (16.2%). In 2020, this was 8.7%.
Of graduates engaged in other activities, 29.6% took time out to travel. In 2020, this was 9.5%.
Graduate Reflections
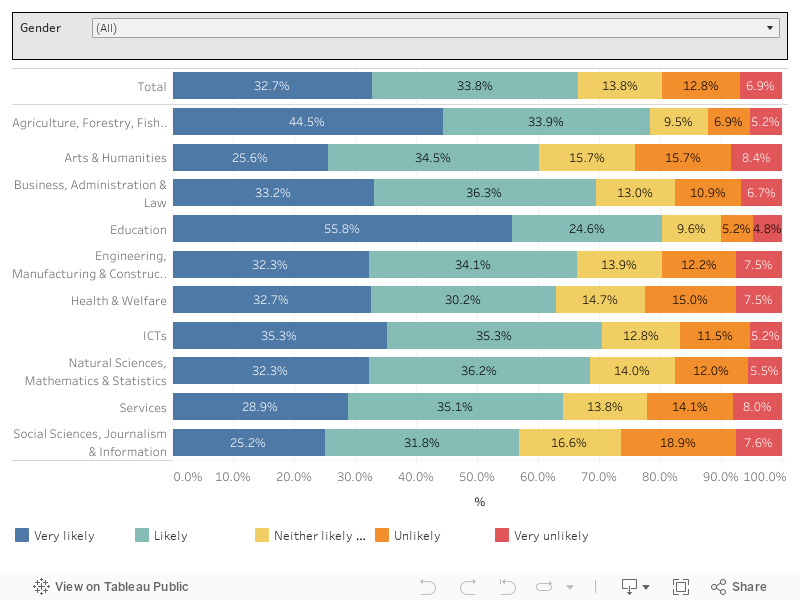
Education graduates are very likely or likely to study the same course again (80.4%), followed by Agriculture, Forestry, Fisheries & Veterinary graduates (78.4%).
Social Sciences, Journalism and Information graduates are least likely to study the same course again, with 1 in 4 Very Unlikely or Unlikely to study the same course again (26.4%), followed by Arts & Humanities graduates (24.1%).
In the StudentSurvey.ie National Report 2022, students were asked:
“How would you evaluate your entire educational experience at this institution?”
One in four (24.5%) Undergraduate Final Year students said “Excellent”, and 50.9% said “Good”. One in five (19.7%) said “Fair”, and 4.9% evaluated their entire educational experience as “Poor”.
More detailed outcomes for the Class of 2021 graduates are available as interactive dashboards at the following links:
Next Chapter: Postgraduate Taught Graduates
Note: filtering can result in a low number of graduates that fit specific criteria. Any criteria that result in fewer than five graduates being represented are excluded from the graphs in this report. Nonetheless, the Total provided will be inclusive of any excluded fields.