
Find information on how to make a Protected Disclosure under the external procedures in place in the HEA.
Find information on how to make a Protected Disclosure under the external procedures in place in the HEA.

INSPIRE is a €750 million investment package that will address research infrastructure needs across the higher education sector while ensuring alignment with national research and innovation priorities.

Tracking graduate outcomes is crucial to improving the quality of education for students and outcomes for graduates.
A Profile of Students with a Disability in HE in Ireland
Data from this analysis comes from the Equal Access Survey (EAS). The EAS is an annual, voluntary set of questions asked of first year full-time and part-time undergraduate students in HEA-funded institutions. These questions are asked as part of the registration process at the start of the academic year, and are conducted by the institutions and returned to the HEA for analysis purposes.
The EAS is a vital source of information to measure progress on national targets, aimed at improving equity of access to higher education and to develop the evidence base and inform policy in this area. Furthermore, the EAS helps us develop a better understanding of the student population and their needs.
This report is the HEA’s first profile of students with a disability in higher education in Ireland, and is designed to serve as a first glance into disability in higher education in Ireland, and to understand future needs.
Responses to the EAS are particularly low amongst part-time students. Therefore, the contents of this report relate to first year full-time undergraduate students in HEA-funded institutions only. This cohort of students are commonly referred to as ‘new entrants’. This report will focus on students from the past three academic years, namely 2019/20, 2020/21, and 2021/22. Note that 2020/21 was the first cohort of students impacted by the COVID-19 pandemic.
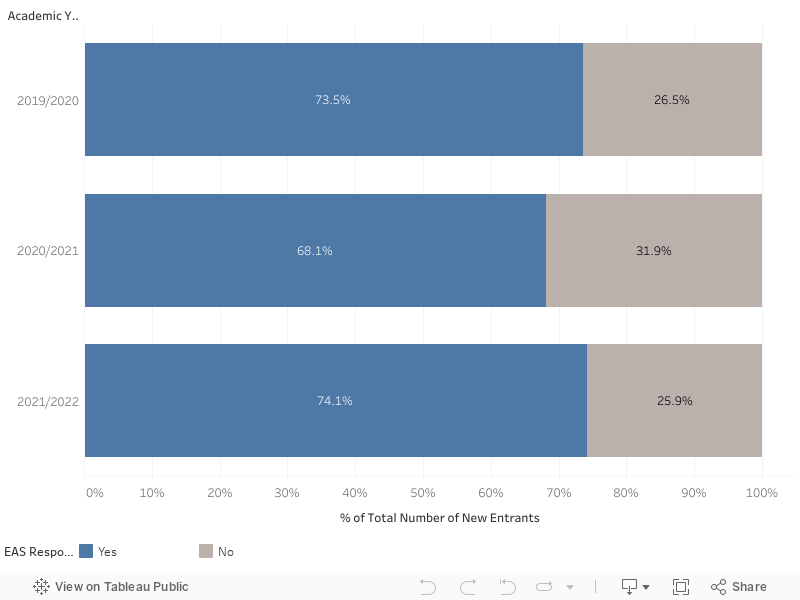
Response rates for first year full-time undergraduate students (or new entrants) are presented below. In the latest academic year, nearly 3 in 4 new entrants responded to the Equal Access Survey. In 2020/21, there was a slight drop, from 73.5% to 68.1%. For an analysis of the profile of respondents versus non-respondents, see Appendix here.
Note that for the purposes of this report, a disabled person has been classified as someone who responded ‘Yes’ to any of the following five categories: (i) blind or deaf, (ii) physical disability, (iii) learning disability, (iv) psychological, emotional, or mental health, and (v) other condition.
Furthermore, note that for the purposes of this report, a person with multiple conditions has been classified as someone who responded ‘Yes’ to two or more of the above five categories.
Therefore, each EAS respondent with a stated disability can be categorised into one of the following six categories: (i) blind or deaf, (ii) physical disability, (iii) learning disability, (iv) psychological, emotional, or mental health, (v) other condition, and (vi) multiple conditions.
The methodology used in this report to calculate the percentage of students with a disability differs to the way it is calculated in the National Access Plan. See table below for a detailed breakdown of differences.
| This report | National Access Plan | |
|---|---|---|
| Number of new entrants | 45,677 | 45,677 |
| Numbers who responded to the EAS | 33,849 | 33,849 |
| Numbers who responded to the EAS and with a disability | 6,035 | 6,035 |
| Calculation for % with a disability | = 6,035 / 33,849 | = 6,035 / 45,677 |
| % with a disability reported | 17.8% | 13.2% |