
Find information on how to make a Protected Disclosure under the external procedures in place in the HEA.
Find information on how to make a Protected Disclosure under the external procedures in place in the HEA.

INSPIRE is a €750 million investment package that will address research infrastructure needs across the higher education sector while ensuring alignment with national research and innovation priorities.

Tracking graduate outcomes is crucial to improving the quality of education for students and outcomes for graduates.
1. Main Graduate Destination
Main Graduate Destination: This refers to the single main activity graduates are doing nine months after graduation.
There are a total of 7 main graduate destination categories. To aid understanding, these can be consolidated and referred to as:
Overview of Graduate Population
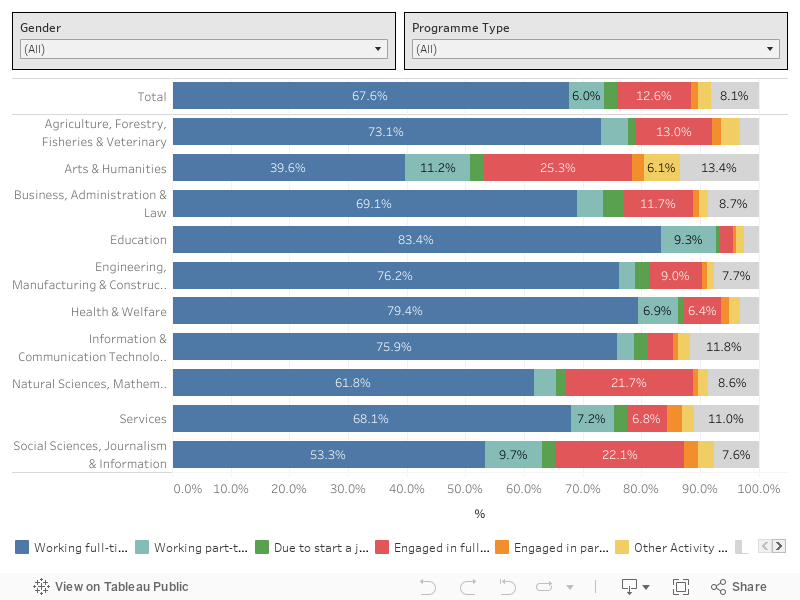
Nine months after graduation, 75.9% of graduates are in employment. In 2018, this was 80.1%. While the proportion of graduates in employment dropped, the proportion of graduates pursuing further study increased slightly to 13.8% in 2020, up from 12.6% in 2018.
Arts & Humanities (53.1%) and Social Sciences, Journalism & Information (65.2%) have the lowest proportion of graduates in employment nine months after graduation. Nonetheless, both fields have a high proportion of graduates pursuing further study nine months after graduation (27.4% of Arts & Humanities graduates; 24.5% of Social Sciences, Journalism & Information graduates).
In 2020, 8.1% of graduates are unemployed nine months after graduation. In 2018, this was 4.3%. Unemployment is highest in Arts & Humanities (13.4%) and ICTs (11.8%).
A more detailed analysis of cohorts most impacted is in 8. COVID-19 Impact.
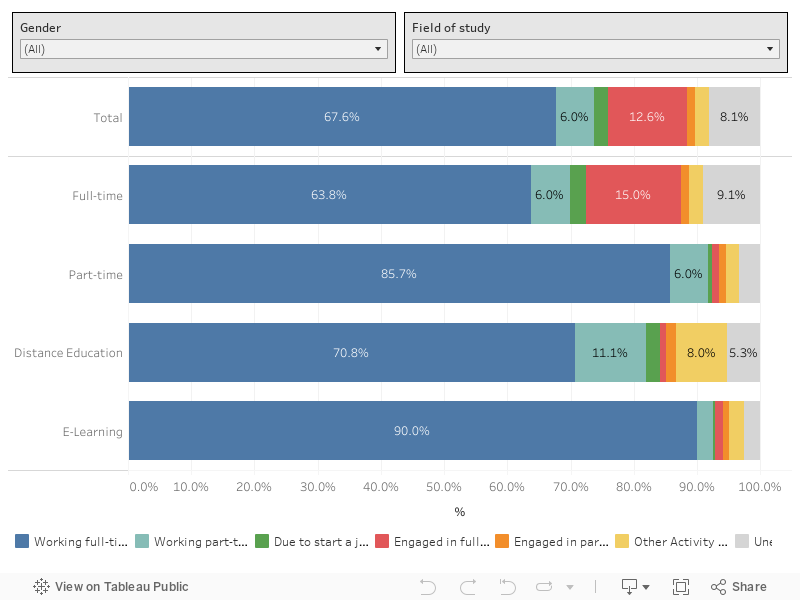
The proportion of Full-Time graduates in employment has dropped to 72.4% in 2020, from 77.7% in 2018. In contrast, the proportion of Part-Time graduates in employment has increased to 92.3% in 2020, up from 90.6% in 2018.
Unemployment has increased for Full-Time graduates, at 9.1% in 2020, up from 4.7% in 2018 – an increase of 3.9 percentage points. The proportion of Part-Time graduates in unemployment has also increased slightly, to 3.4% in 2020, up from 2.9% in 2018.
More detailed outcomes for the Class of 2020 graduates are available as interactive dashboards at the following links:
Next Chapter: Level 6 & 7 Graduates
Note: filtering can result in a low number of graduates that fit specific criteria. Any criteria that result in less than five graduates being represented are excluded from the graphs in this report. Nonetheless, the Total provided will be inclusive of any excluded fields.