
Find information on how to make a Protected Disclosure under the external procedures in place in the HEA.
Find information on how to make a Protected Disclosure under the external procedures in place in the HEA.

INSPIRE is a €750 million investment package that will address research infrastructure needs across the higher education sector while ensuring alignment with national research and innovation priorities.

Tracking graduate outcomes is crucial to improving the quality of education for students and outcomes for graduates.
4. Geographic Profile
This chapter explores the geographical element to socio-economic backgrounds, such as:
Note: A student’s home address relates to their family home, not term-time accommodation. Note that with any filter combination in the below graph, if the minimum number of students by county and filter combination is less than 100 students, then no DIS will appear. This does not mean that no students attend a particular institute from a particular county. Instead, there are less than 100 students for that particular combination.
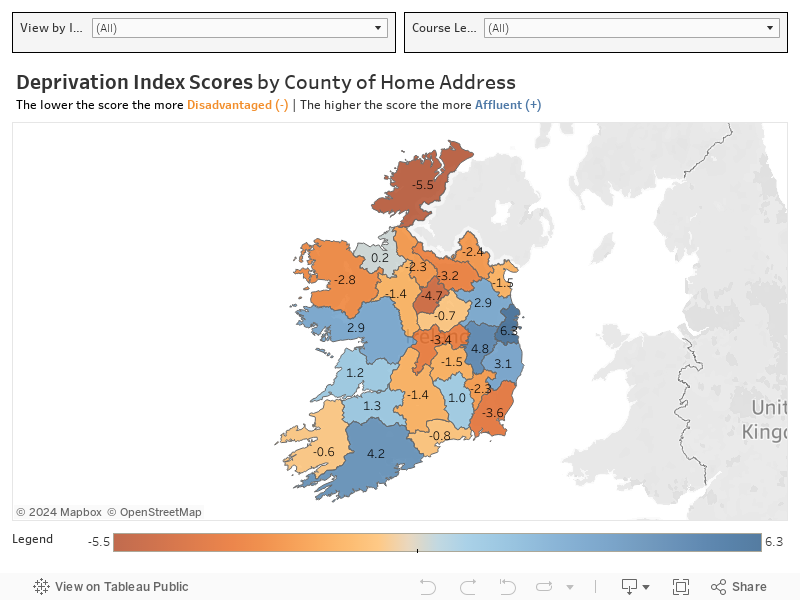
Key Finding: Looking at all students, students with a home address in Dublin are most affluent (DIS = 6.3), while students from Donegal are most deprived (DIS = -5.5). Note that the average DIS is 2.1 for all students.
Overall, the average DIS for Undergraduate students is 1.7.
Students with a home address in Dublin (DIS = 5.7) are the most affluent. This is followed by Kildare (DIS = 4.6) and Cork (DIS = 3.9).
Donegal students are the most disadvantaged (DIS = -5.8), followed by students from Longford (DIS = -4.8), and Wexford (DIS = -3.7).
Amongst Postgraduate students, the average DIS is 3.8.
Similar to Undergraduate students, Dublin (DIS = 8.4), Kildare (DIS = 5.7) and Cork (DIS = 5.3) students are the most affluent.
Donegal and Longford students are most disadvantaged, with a DIS of -4.1.
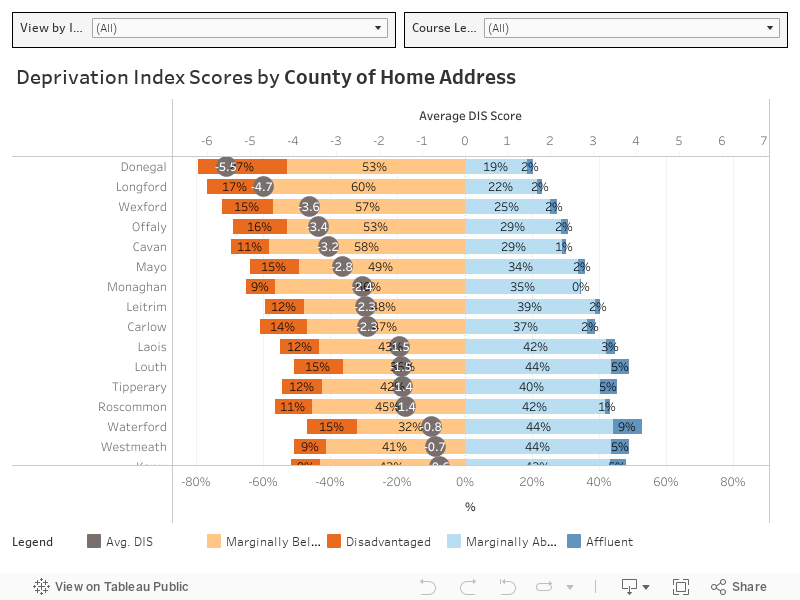
More than one in four students with a home address in Donegal are Disadvantaged (27%). A further 53% are from Marginally Below Average areas. This means that only 21% of Donegal students come from Marginally Above Average or Affluent areas. Note that the average DIS for Donegal higher education students in Ireland is -5.5. For the total Irish population, this is -6.4 (Haase & Pratschke, 2017).
Longford has the highest proportion of students from Marginally Below Average areas (60%).
Students with a home address in Dublin are most affluent (DIS = 6.3). Two in five are from Affluent areas (42%), while more than one-third are from Marginally Above Average areas (35%). This means that more than 3 in 4 students from Dublin are either from Affluent or Marginally Above Average areas (77%). On average, for all students, this is 62%.
Meath has the highest proportion of students from Marginally Above Average areas (57%).
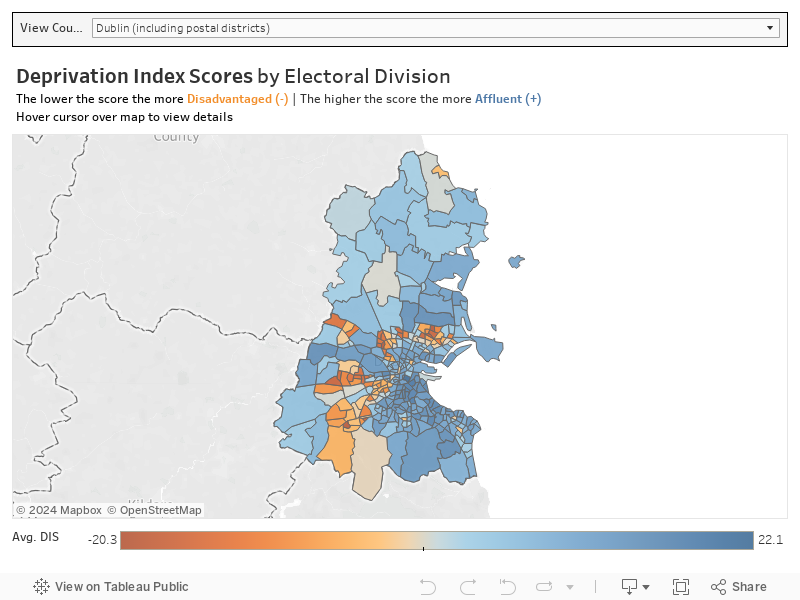
Note: For the below dashboard, there is a minimum cell count of 25 students per Electoral Division applied. For the rest of the report, the minimum applied is 100 students. The average DIS is 2.1.
Note: Average travel time is calculated using the shortest distance available by car as the mode of transport. The calculation is based on the distance between a student’s home address and their institute. This mode of transport is selected to provide a consistent, comparable metric – not all areas have access to public transport, potentially skewing results. Nonetheless, it is acknowledged that not all students have access to a car.
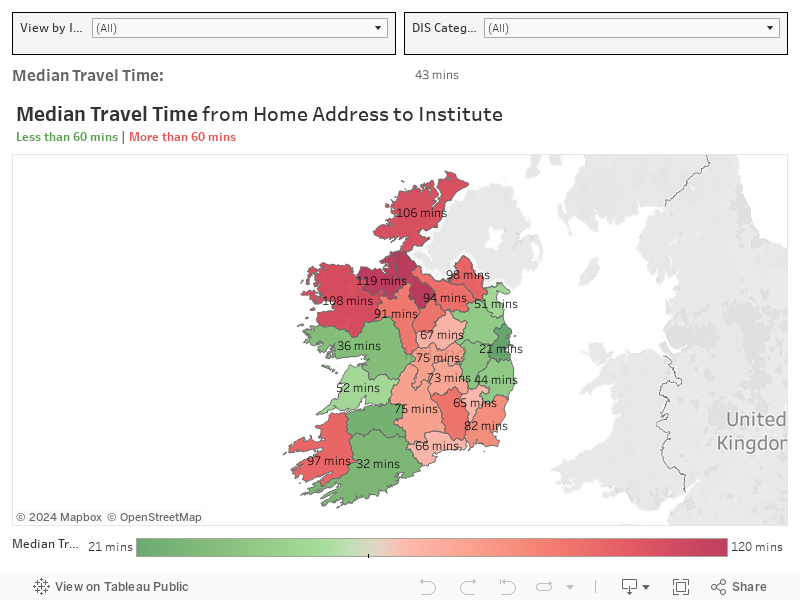
Key Finding: The median travel time from a student’s home address to their Institute is 43 minutes. Students from Dublin have the shortest travel time (21 minutes), while students from Leitrim have the longest travel time (120 minutes or 2 hours). By DIS category, Affluent students have the shortest travel time, at 23 minutes. This is 50 minutes for Disadvantaged students.
Of all the counties, students with a home address in Dublin have the shortest travel time (median of 21 minutes) from their home address to their chosen Institute. Note that refers to their original family home, not term-time accommodation.
Leitrim students have the longest travel time, at 120 minutes. This is followed by Sligo, at 119 minutes.
Students in TU Dublin have the shortest median travel time from original home address to campus, at 26 minutes. This is followed by IADT, at 27 minutes.
Students in St. Angela’s College have the longest median travel time, at 113 minutes.