Find information on how to make a Protected Disclosure under the external procedures in place in the HEA.
Find information on how to make a Protected Disclosure under the external procedures in place in the HEA.

INSPIRE is a €750 million investment package that will address research infrastructure needs across the higher education sector while ensuring alignment with national research and innovation priorities.

Tracking graduate outcomes is crucial to improving the quality of education for students and outcomes for graduates.
3. Course Profile
This chapter explores the socio-economic background of higher education students by the following characteristics:
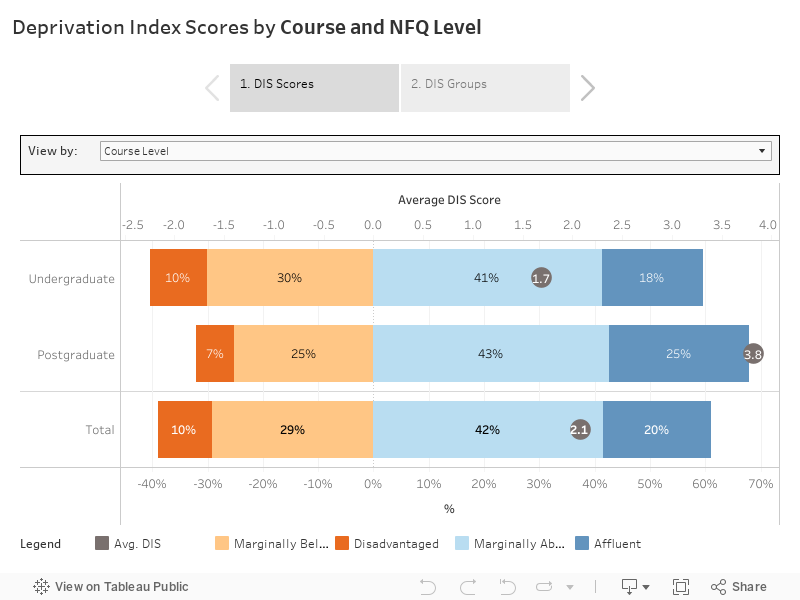
Course Level: Postgraduates (DIS = 3.8) tend to be more affluent than Undergraduate students (DIS = 1.7). One in four Postgraduate students are Affluent, compared to 18% of Undergraduate students.
Almost 1 in 4 Affluent students are studying Postgraduate programmes (24%), compared to only 13% of Disadvantaged students.
NFQ Level: By NFQ Level, those studying NFQ Level 6 and 7 programmes tend to be most deprived, with a DIS of 0.5 and 0.3, respectively. Meanwhile, those studying NFQ Level 10 programmes are most affluent (DIS = 4.5). Only 6% of NFQ Level 10 students come from Disadvantaged areas.
A much higher proportion of Disadvantaged students are studying NFQ Level 7 programmes (17%) compared to Affluent students (9%).
Only one in ten Disadvantaged students are pursuing NFQ Level 9 programmes, compared to 19% of Affluent students.
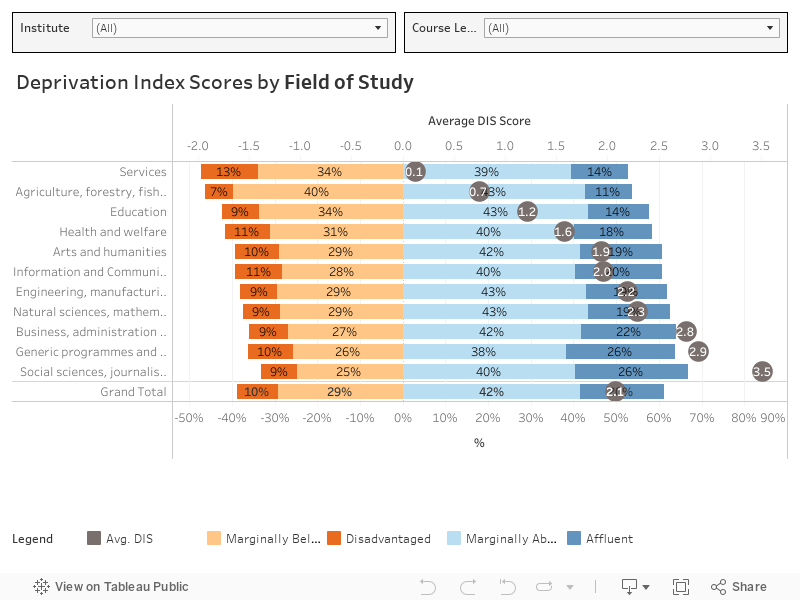
Field of Study: Undergraduate students studying Services are the most deprived (DIS = -0.1). Note that the average DIS for all Undergraduates is 1.7. Social Sciences, Journalism & Information students are most affluent (DIS = 3.3). One in four of these students are Affluent. For further breakdowns by detailed field of study, see below.
Programme Type: Undergraduate students studying Foundation programmes are most deprived (DIS = -0.9), with 17% of students coming from Disadvantaged areas. Students studying Occasional programmes are most Affluent (DIS = 3.9)., where more than one in four are Affluent.
Institute: SETU students are most deprived (DIS = -1.7), where 16% of students come from Disadvantaged areas. This is followed by Dundalk IT (DIS = -1.6). At the opposite end, TCD students are most affluent (DIS = 5.6). More than 1 in 3 are Affluent (36%). This is followed by UCD students (DIS = 5.4) and RCSI students (DIS = 5.2).
Field of Study: Overall, for Postgraduates, the average DIS is 3.8. Education students are relatively deprived (DIS = 2.4). However, note that 63% of these students are Marginally Above Average or Affluent. Postgraduate students studying Generic Programmes & Qualifications are most affluent (DIS = 5.9). This is followed by Business, Administration & Law students (DIS = 4.8).
Programme Type: Masters Research students are relatively deprived (DIS = 1.3). One in ten students are from Disadvantaged areas. Meanwhile, students of Professional Training Qualifications are most affluent (DIS = 4.8). This is followed by PhD students (DIS = 4.5).
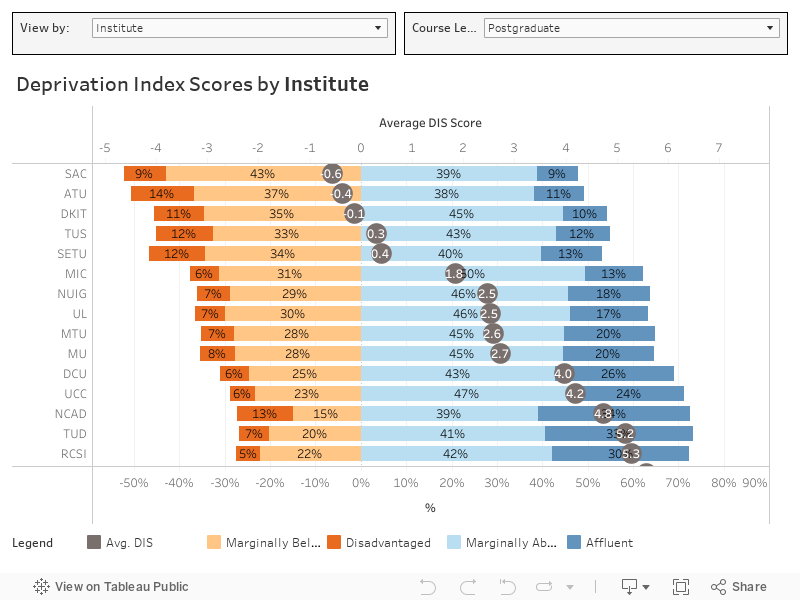
Institute: For Postgraduates, students from St. Angela’s College are relatively deprived (DIS = -0.6). Just over half (52%) are from Disadvantaged or Marginally Below Average areas. IADT students are most affluent (DIS = 7.4). Almost half (47%) of students are Affluent, while one in three are Marginally Above Average. Only 21% of IADT students are from Disadvantaged or Marginally Below Average areas.
Field of Study: The most common field of study for all Undergraduate students is Business, Administration & Law (23%). This is followed by Arts & Humanities (15%) and Health & Welfare (15%). Health & Welfare is a slightly more popular option among Disadvantaged students (18%) compared to Affluent students (14%). Similarly, Services is a slightly more popular option for Disadvantaged students (7%) than Affluent students (4%).
Programme Type: Four in five Affluent students pursue an Undergraduate Honours Degree (81%), compared to 71% of Disadvantaged students. An Undergraduate General Degree is more common for Disadvantaged students (15%) than Affluent students (6%).
Institute: By Institute, the three most common institutes for Disadvantaged students are TU Dublin (14%), ATU (14%), and SETU (13%). However, note that the overall size and intake of each of these Institutes influences results here – compare to the Total to observe differences. For example, ATU students represent 9% of the total Undergraduate population, but ATU students represent 14% of total Disadvantaged students.
Field of Study: Amongst Postgraduate students, Health & Welfare (23%), Business, Administration & Law (22%), and Education (15%) are the three most common choices. Business, Administration & Law is a slightly more popular choice amongst Affluent students (26%) than Disadvantaged students (20%). In contrast, Education is a slightly more popular choice amongst Disadvantaged students (16%) than Affluent students (11%).
Programme Type: Only 5% of Affluent students are studying Higher Diplomas, compared to one in ten Disadvantaged students. Nonetheless, overall, there are no major differences observed. However, it is worth reiterating that overall, a much lower proportion of Disadvantaged students are pursuing Postgraduate courses – 13% of Disadvantaged students, compared to 24% of Affluent students. This represents a 11-percentage point difference.
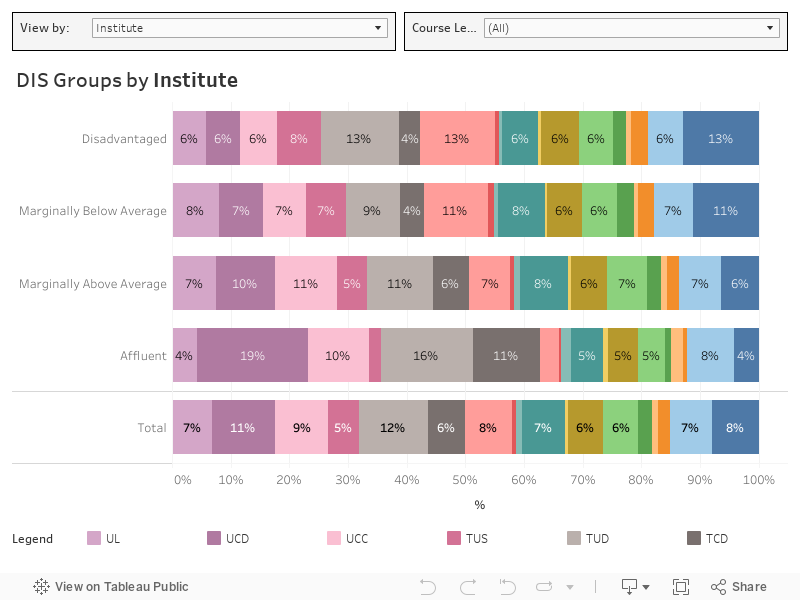
Institute: For Postgraduate students, UCD (12%) and UCC (12%) are the two most common choices for Disadvantaged students. However, note that overall, UCD students represents 18% of the total student population. While SETU students make up 5% of the total Postgraduate student population, SETU students make up 10% of the total Disadvantaged student population.
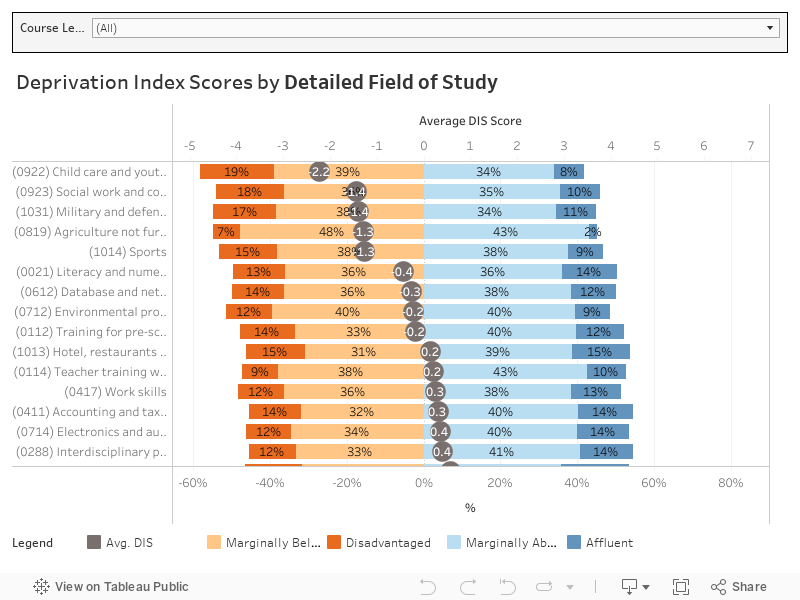
Key Finding: Of all students, Child Care and Youth Services students are the most deprived (DIS = -2.2), where 19% of students are Disadvantaged. This is followed by Social Work and Counselling (DIS = -1.4). Meanwhile, Economics students are the most affluent (DIS = 6.8), where 80% of students are Marginally Above Average or Affluent.
At Undergraduate Level, Child Care and Youth Services students are most deprived (DIS = -2.3). Most students are either Disadvantaged (20%) or Marginally Above Average (39%). This is followed by students studying Social Work and Counselling. One in five of these students are Disadvantaged.
Undergraduate Economics students tend to be relatively affluent (DIS = 7.5). Only 4% of these students are Disadvantaged, while 44% are Affluent. Moreover, 38% are Marginally Above Average. This means that 82% of Undergraduate Economics students come from Marginally Above Average or Affluent areas.
This is followed by Undergraduate Medicine students (DIS = 5.7), and Statistics (DIS = 4.9).
The overall average DIS score for Postgraduate students is 3.8.
Similar to what is observed at Undergraduate level, Child Care and Youth Services is relatively deprived (DIS = -1.4). More than half (58%) of students are Disadvantaged or Marginally Below Average. This is followed by Sports students (DIS = 0.6).
In contrast, Computer Use students are most affluent (DIS = 7.1), followed by Personal Skills and Development students (DIS = 6.2).
Note: The below dashboard explores data by Institute and by Course Level. Hover over the Field of Study and click “+” to expand to Detailed Field of Study. Deprivation Index Scores by Field of Study vary by Institute. Caution must be taken when interpreting findings, noting the differing underlying student demographics that may be influencing findings, or indeed, detailed fields of study.