Find information on how to make a Protected Disclosure under the external procedures in place in the HEA.
Find information on how to make a Protected Disclosure under the external procedures in place in the HEA.

INSPIRE is a €750 million investment package that will address research infrastructure needs across the higher education sector while ensuring alignment with national research and innovation priorities.

Tracking graduate outcomes is crucial to improving the quality of education for students and outcomes for graduates.
Graduate Outcomes & Disability: Methodology
This analysis involves the joining of data from two HEA databases: the Equal Access Survey database and the Graduate Outcomes Survey.
The Equal Access Survey (EAS) is an annual, voluntary set of questions asked of first year undergraduate students to HEA-funded institutions. The questions are asked as part of the registration process at the start of the academic year, and data is collected on student disability and the nature of that disability.
The EAS has historically considered full-time undergraduate new entrants to higher education (with part-time included more recently); therefore those who did not enter through full-time undergraduate education might not have been offered the survey.
The EAS has a response rate of roughly 70% each year, however this response rate varies by question and by higher education institution.
The Graduate Outcomes Survey (GOS) is an annual, voluntary survey of graduates of HEA-funded institutions. The survey is carried out approximately nine months after graduation, and includes questions on employment, further study, unemployment and other activities.
On average, the response rate nationally is approximately 50%. The GOS database holds records of graduates who respond and do not respond to the survey.
Records were extracted from the EAS from 2007/08 to 2020/21, and were linked with Graduate Outcomes Survey returns for 2018 (Class of 2017), 2019 (Class of 2018) and 2021 (Class of 2020). All students who indicated that either they have a disability, or they do not have a disability, were linked with Graduate Outcomes Survey records. Records were matched across higher education institution, student ID and date of birth in both datasets.
There is no linked EAS data available for 2018/19 due to Data Protection issues; however, this has a limited impact on the analysis presented here. This is because EAS data for those entering in higher education 2018/19 has few linked records with the GOS data under consideration (surveys in 2018, 2019 and 2021). There is no GOS data for 2020 due to the onset of the Covid-19 pandemic at the time of the survey fieldwork.
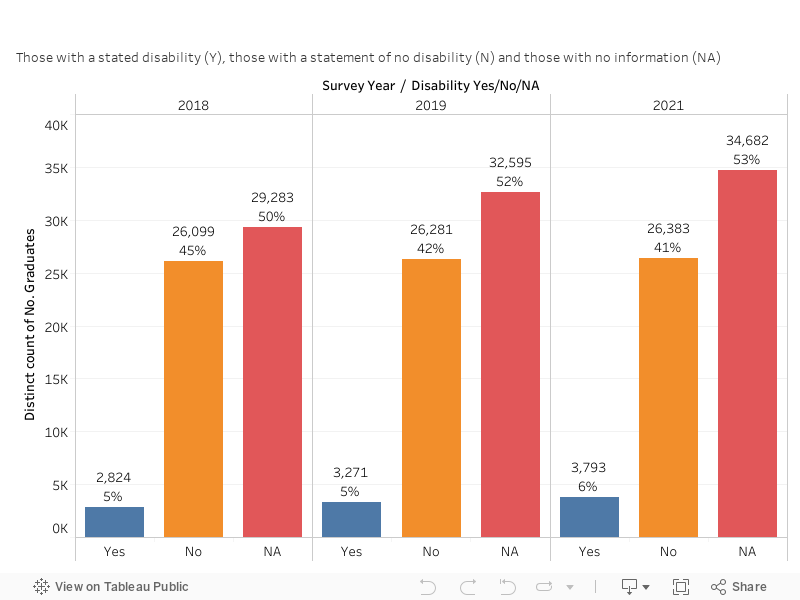
Matched records
The following chart shows the number of linked records for each year of the GOS (2018, 2019 and 2021), setting out those matched records of those with a stated disability, those with a statement of no disability, and the remainder of unlinked records with no information about disability. In total 9,888 EAS records found a matched GOS record. It is important to note, as above, that these are the total number of matched records, not the total number of available graduate outcomes survey responses. Within these 9,888 GOS records, there are 9,279 individual graduates. This is the total sample under consideration in this analysis; however, not all of these graduates have responded to the GOS, and that is discussed further below.
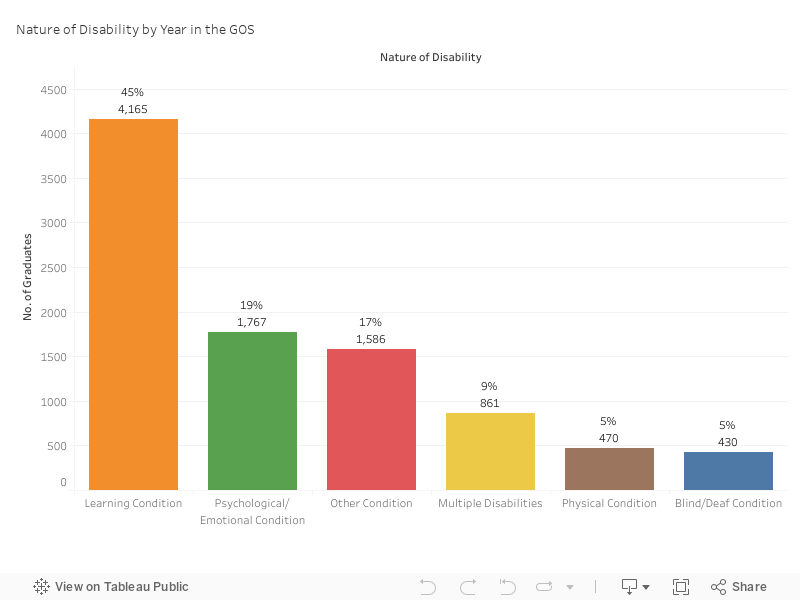
Nature of Disability
The following chart shows the type of disability indicated by the 9,279 graduates matched between the EAS and GOS databases. The largest group of graduates indicated a learning disability (45%), the next largest group indicated a psychological/emotional condition (19%), followed by other condition (17%), followed by those who indicated more than one disability (9%). The smallest two groups of graduates with a disability indicated a physical condition (5%) or a blind/deaf condition (5%).
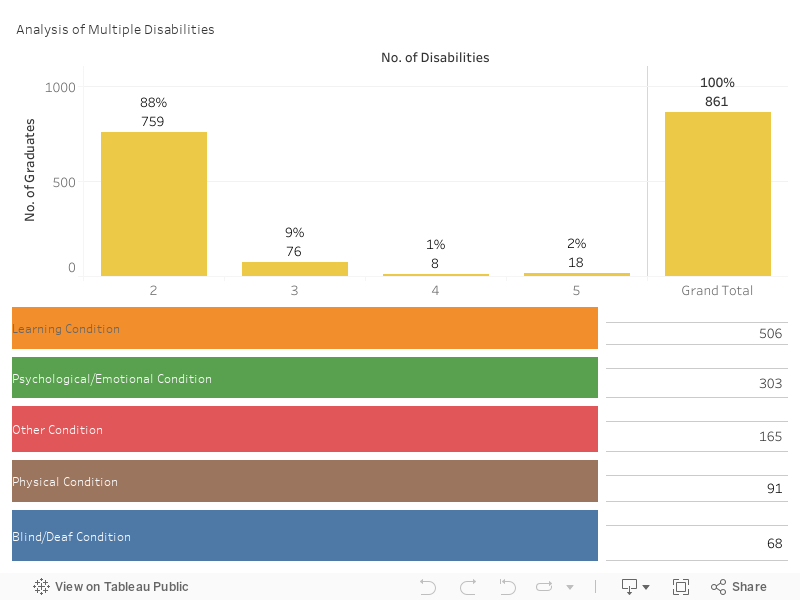
Those with multiple disabilities were grouped separately to assess the impact of having more than one disability on graduate outcomes. An analysis of multiple disabilities is given in the chart below, which shows that 88% of those with more than one disability indicated two disabilities; 9% indicated three disabilities, and 3% indicated four or five disabilities.
Graduate Outcomes Response Rates
Of the 9,888 matched EAS-GOS records, a total of 60% or 5,937 had a graduate outcomes survey response, either survey response or response through administrative data for undergraduates at level 6 or 7. The following table gives response rates at different levels of study.
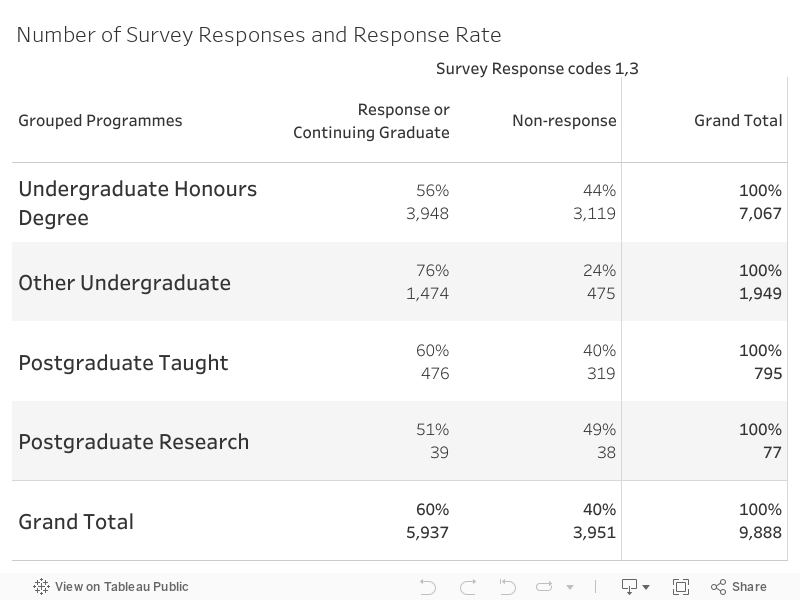
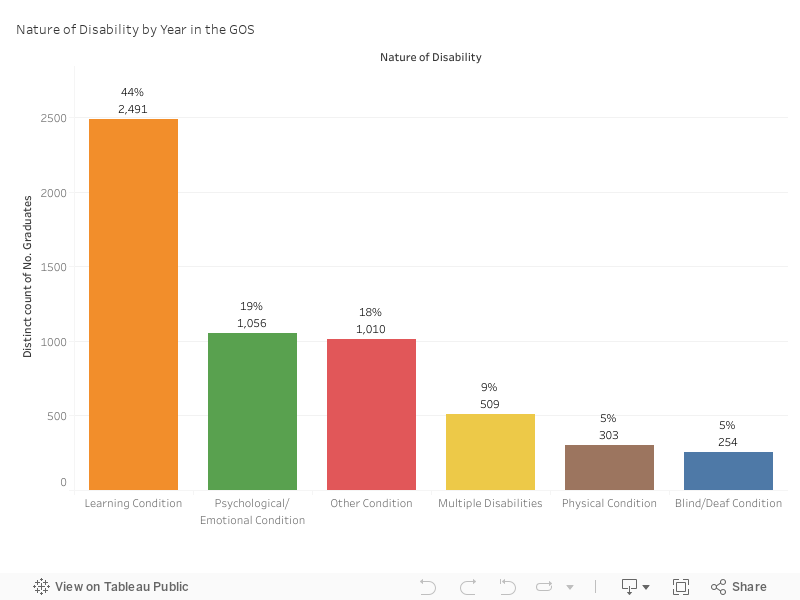
Matched records with a graduate outcome
Of the 5,937 graduates with a graduate outcome, 5,623 of these were individuals. The following chart shows the type of disability indicated by the 5,623 individual graduates matched between the EAS and GOS databases with a graduate outcome. The largest group of graduates indicated a learning disability (44%), the next largest group indicated a psychological/emotional condition (19%), followed by other condition (18%), followed by those who indicated more than one disability (9%). The smallest two groups of graduates with a disability indicated a physical condition (5%) or a blind/deaf condition (5%).