
Find information on how to make a Protected Disclosure under the external procedures in place in the HEA.
Find information on how to make a Protected Disclosure under the external procedures in place in the HEA.

INSPIRE is a €750 million investment package that will address research infrastructure needs across the higher education sector while ensuring alignment with national research and innovation priorities.

Tracking graduate outcomes is crucial to improving the quality of education for students and outcomes for graduates.
Graduate Outcomes & Socio-Economic Status: Graduate Profile
This chapter explores the socio-economic profile for graduates based on:
Note: Deprivation Index Scores range from a scale of approximately -40 (most disadvantaged) to +40 (most affluent). The lower the score, the more deprived; the higher the score, the more affluent.
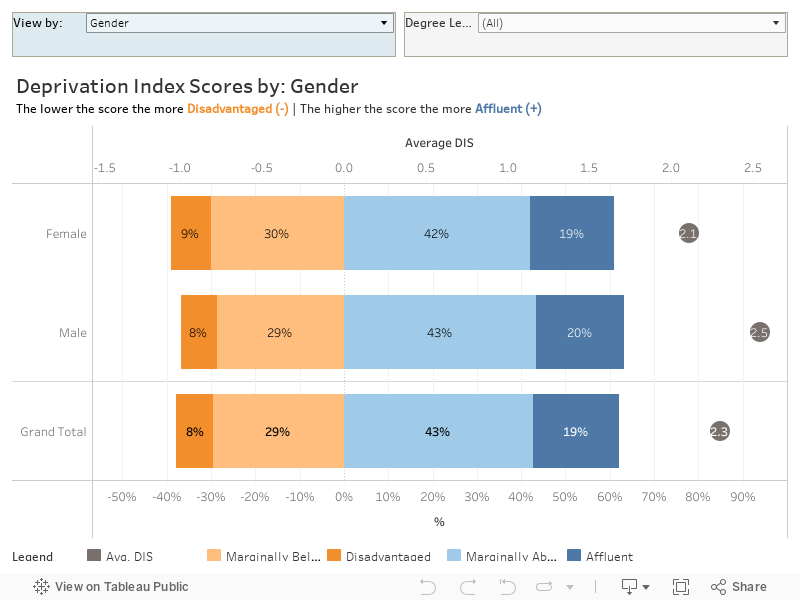
Overall, almost one in five graduates from the class of 2020 were from affluent backgrounds while fewer than one in 10 were from disadvantaged backgrounds. The overall average deprivation index score was 2.3. Across degree levels, those graduating with an undergraduate degree were from less affluent areas (1.8) than those graduating with a postgraduate degree (3.7).
Gender: on average female graduates were less affluent than males, albeit the gap was relatively small between the two groups (2.1 versus 2.5). This holds true for those graduating with an undergraduate and a postgraduate degree.
Mode of Study: One in four part-time graduates were from affluent backgrounds, compared to fewer than one in five full-time graduates. There were notable differences in relative affluence across mode of study depending on degree level awarded. For example, part-time undergraduates were less affluent than full-time undergraduate graduates. In contrast, at postgraduate level, part-time graduates tend to be more affluent.
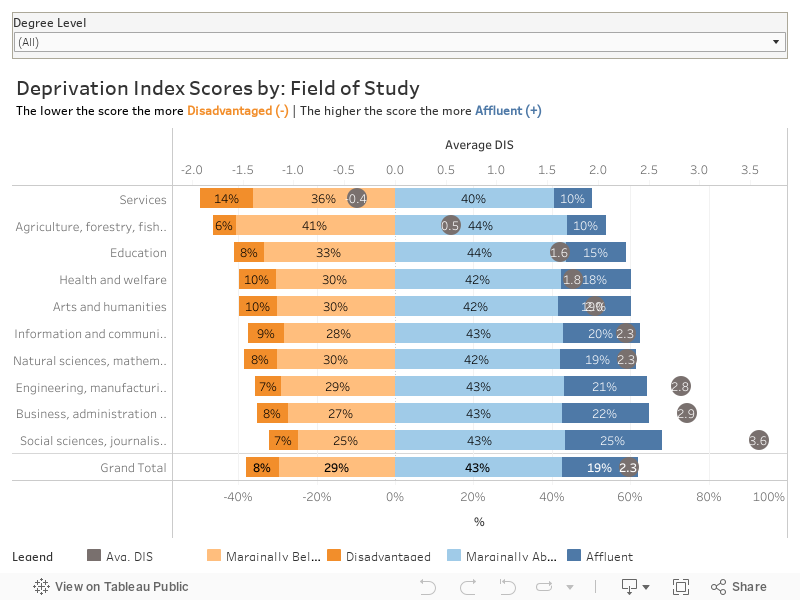
Overall, one in four Social Sciences, Journalism & Information graduates were from affluent backgrounds, while the average DIS was 3.6. In contrast, there was an equal proportion of Services graduates from disadvantaged/marginally below average backgrounds as there was from affluent/ marginally above average backgrounds. At 14%, Services had the highest share of graduates from disadvantaged backgrounds.
At undergraduate level, Social Sciences, Journalism & Information had the highest average DIS value (3.4), followed by Business Administration & Law (2.3) and Engineering, Manufacturing & Construction graduates (2.2). Services (-0.6) and Agriculture, Forestry, Fisheries & Veterinary (0.1) had the lowest average DIS values.
In terms of postgraduates, approximately three in 10 ICT, Engineering, Manufacturing & Construction, and Business, Administration & Law graduates were from affluent backgrounds. In contrast, Services had the highest proportion of Disadvantaged graduates at 11%, followed by Education graduates (9%).