Find information on how to make a Protected Disclosure under the external procedures in place in the HEA.
Find information on how to make a Protected Disclosure under the external procedures in place in the HEA.

INSPIRE is a €750 million investment package that will address research infrastructure needs across the higher education sector while ensuring alignment with national research and innovation priorities.

Tracking graduate outcomes is crucial to improving the quality of education for students and outcomes for graduates.
Appendix
An Overview of the Profile of Respondents versus Non-Respondents
Three years of new entrant data were pooled together for the overview provided below, namely 2019/20, 2020/21, and 2021/22.
Overall, the profile of EAS respondents largely resembles the profile of the new entrant student population. As noted in the Introduction, in 2021/22, 74.1% of full-time undergraduate new entrants responded to the Equal Access Survey.
Graduate Outcomes for Students with a Disability
The ambition for supporting students with a disability goes beyond increasing participation rates. It is essential to also consider the experiences of students with a disability in higher education and their graduate outcomes. Graduate outcomes for students with a disability are available here.
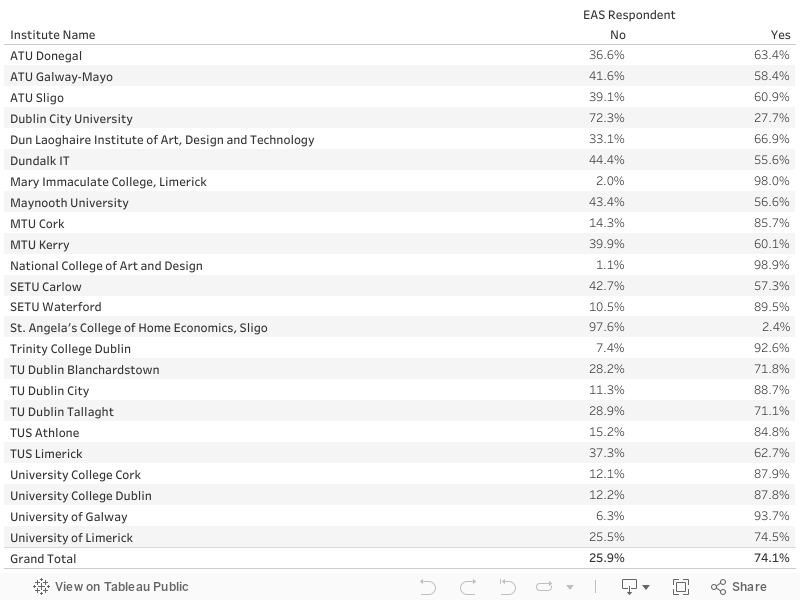
Response Rates by Institute
Every year, the Equal Access Survey (EAS) is distributed to first year undergraduate new entrants. As noted in the Introduction, response rates to the EAS is particularly low for part-time students. Hence, the below table outlines the response rates for full-time first year undergraduate new entrants only by institute in 2021/22. The overall response rate is 74.1%.