
Find information on how to make a Protected Disclosure under the external procedures in place in the HEA.
Find information on how to make a Protected Disclosure under the external procedures in place in the HEA.

INSPIRE is a €750 million investment package that will address research infrastructure needs across the higher education sector while ensuring alignment with national research and innovation priorities.

Tracking graduate outcomes is crucial to improving the quality of education for students and outcomes for graduates.
Introduction
While the majority of students do progress to the following academic year, some do not; therefore, the focus of this and the following sections is non-progression. For this analysis, a student is deemed to have not progressed if they are not present either in their own or another HEI following academic year (i.e. the year after commencing study as a New Entrant). The aim of this section is to identify overall rates of non-progression by HEI, NFQ/ISCED level and Field of Study. The following sections will look at non-progression by student characteristics (demographic and educational background). When interpreting the data available on this and the following pages please note the following:
The non-progression rates described in this section, and in the three following sections, reflect the number of students that did not progress expressed as a percentage of the total number of new entrants for the relevant cohort. The tables in this report are purely descriptive. Non-progression rates are influenced by various factors. As such, comparisons of unadjusted non-progression rates across institutes may be confounded by differences in individual and institutional factors. For more detailed exploration of the factors that may influence non-progression, please see the regression analysis sections of previous years reports, for example this detailed report published in 2024.
Most importantly, this study is purely quantitative in nature: It does not provide any insight on the motivation for enrolling in Higher Education, the financial well-being of students, study patterns, student views on teaching methodologies and staff, the effect (good or bad) of participation in extra-curricular activities as well as the work practices of non-progressing students. Rather, these analyses should be viewed as providing quantitative data to underpin ongoing constructive and collective engagement on the challenges faced by the system in ensuring progression and successful completion for undergraduate students.
Please note, in the interactive tables on this section, non-progression rates are not shown in cells where the numbers of students are less than 25. This is in line with our statistical disclosure policy.
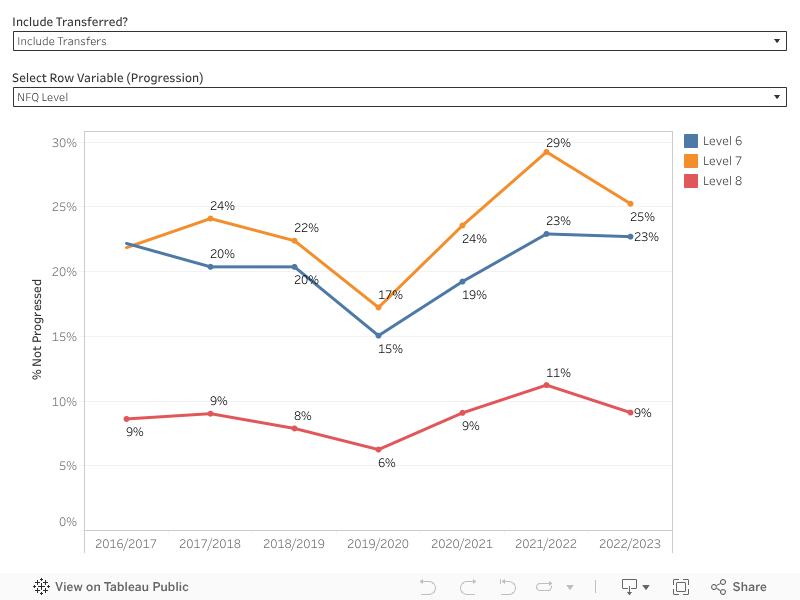
The following chart shows the trend in non-progression rates for New Entrants in the academic years 2016/2017 to 2022/2023. The user can choose to view the non-progression rates by NFQ Level, ISCED Level of Education (for international comparability), Field of Study or HEI by selecting an option from the “Row Select Variable (Progression)” dropdown menu.
Please exercise caution when comparing non-progression rates across NFQ Levels, Fields of Study and particularly when comparing Non-progression rates by HEI. Different HEIs have different mixes of course offerings: the “traditional” universities do not provide Level 6 or 7 courses to full-time undergraduates while some colleges (art colleges, teacher training colleges) are more limited in the subjects on offer.
In previous years, calculation of non-progression rates only took account of students who did not progress within their own HEI. For this and for future years, analysis of non-progression will take into account students who are present in other HEIs (“transfers”). For comparison with previous years non-progression analyses, the user can select “Do not include transfers” from the “Include Transfers?” drop-down menu.
2022/23 New Entrants – Key Findings:
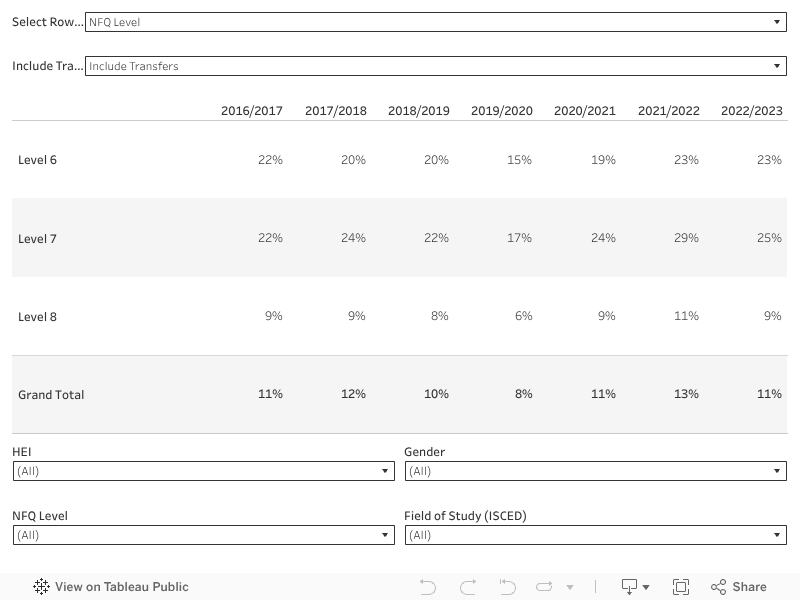
The following interactive table allows the user to select the row variable from the “Select Row Variable (Progression)” dropdown: NFQ Level, Field of Study or HEI. The user can also apply filters from the dropdown menus below the table. For comparison with previous years non-progression analyses, the user can select “Do not include transfers” from the “Include Transfers?” drop-down menu.
Go to next section: Non-progression by Student Characteristics - Part 1