
Find information on how to make a Protected Disclosure under the external procedures in place in the HEA.
Find information on how to make a Protected Disclosure under the external procedures in place in the HEA.

INSPIRE is a €750 million investment package that will address research infrastructure needs across the higher education sector while ensuring alignment with national research and innovation priorities.

Tracking graduate outcomes is crucial to improving the quality of education for students and outcomes for graduates.
This is the first of two sections looking at non-progression rates by student characteristics, focusing on demographics, particularly Gender and Socio-Economic Background.
The following are the key findings of non-progression rates by student characteristics:
Again, it is important to note that the tables in this report are purely descriptive. Non-progression rates are influenced by various factors. As such, comparisons of unadjusted non-progression rates across institutes may be confounded by differences in individual and institutional factors. Therefore, these headline statistics should be interpreted with caution: Previous analyses applied multiple logistic regression to control factors such as NFQ level, subject choice (field of study) and leaving cert points. The findings suggested that other factors notwithstanding, leaving certificate points are the factor with the largest effect on non-progression of new entrants. For more detailed exploration of the factors that may influence non-progression, please see the regression analysis sections of previous years reports, for example this detailed report published in 2024.
Please note, in the interactive tables on this and the following pages, non-progression rates are not shown in cells where the numbers of students are less than 25. In the case of socio-economic breakdown (DIS) and SUSI Grant holders, as well as all entry basis (next section) the threshold is 100. This is in line with our statistical disclosure policy.
Gender
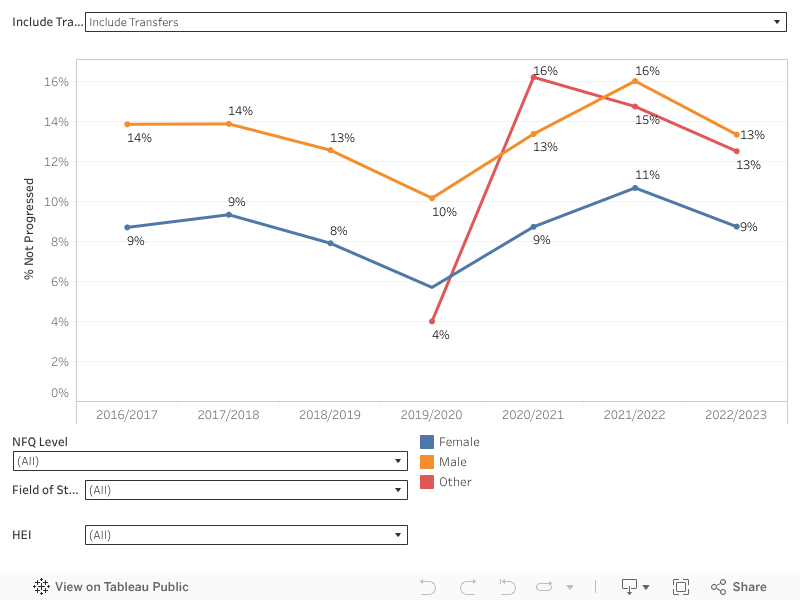
The following chart shows the trend in non-progression rates by gender.
The percentage of New Entrants identifying as female has risen from 51% in 2016/2017 to 54% in 2022/2023. New entrants identifying as Other (i.e. non-binary or undeclared) is below 1% for the relevant years. Due to the low numbers of persons in this category, only students identifying as female or male are shown in the subsequent tables.
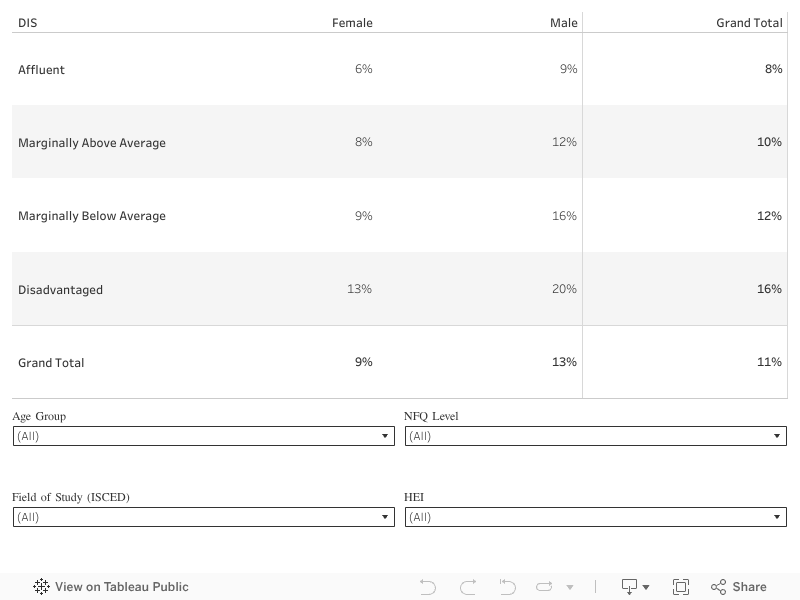
The HEA uses home addresses of ROI domiciled students to using to develop socio economic profiles of HEIs by assigning Deprivation Index Scores (DIS) to the student data. Please refer to this page for the methodology.
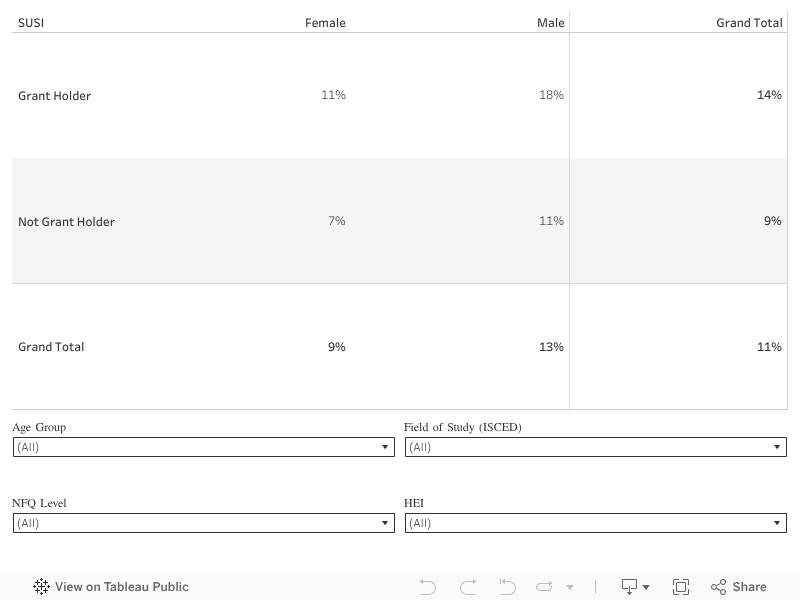
Students who were in receipt of a SUSI grant have higher rate of non-progression (14%) than those not in receipt (9%). As with other data in this section, the headline rates of non-progression must be interpreted with caution. Please see the following report for context.
Go to Next Section: Non-progression by Student Characteristics - Part 2