
Find information on how to make a Protected Disclosure under the external procedures in place in the HEA.
Find information on how to make a Protected Disclosure under the external procedures in place in the HEA.

INSPIRE is a €750 million investment package that will address research infrastructure needs across the higher education sector while ensuring alignment with national research and innovation priorities.

Tracking graduate outcomes is crucial to improving the quality of education for students and outcomes for graduates.
Graduate Outcomes Survey: Sectors and Occupations
Focus on Occupations
As noted previously, the following is a list of occupations collected in the Graduate Outcomes Survey:
The chart below displays graduate occupations overall years of the Graduate Outcomes Survey, and the reader can be select programme type, field of study, and year.

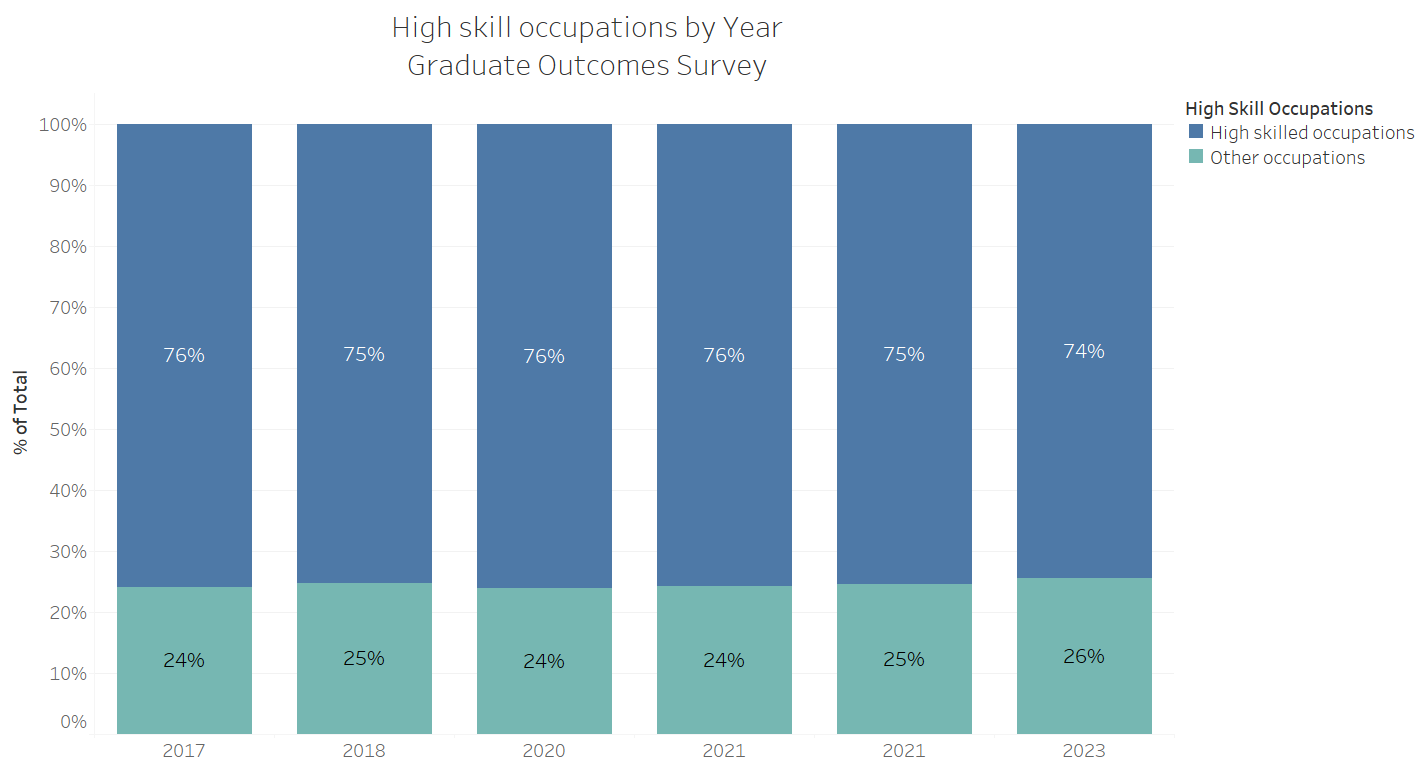
The following chart gives the percentage of graduates who moved directly into high skilled occupations by year and shows that there has been little change in the occupational skill level of graduates between 2017 and 2023.
Programme Type
We consider different programme types in more detail here.
Honours Degree Graduates
Postgraduate Degree Graduates
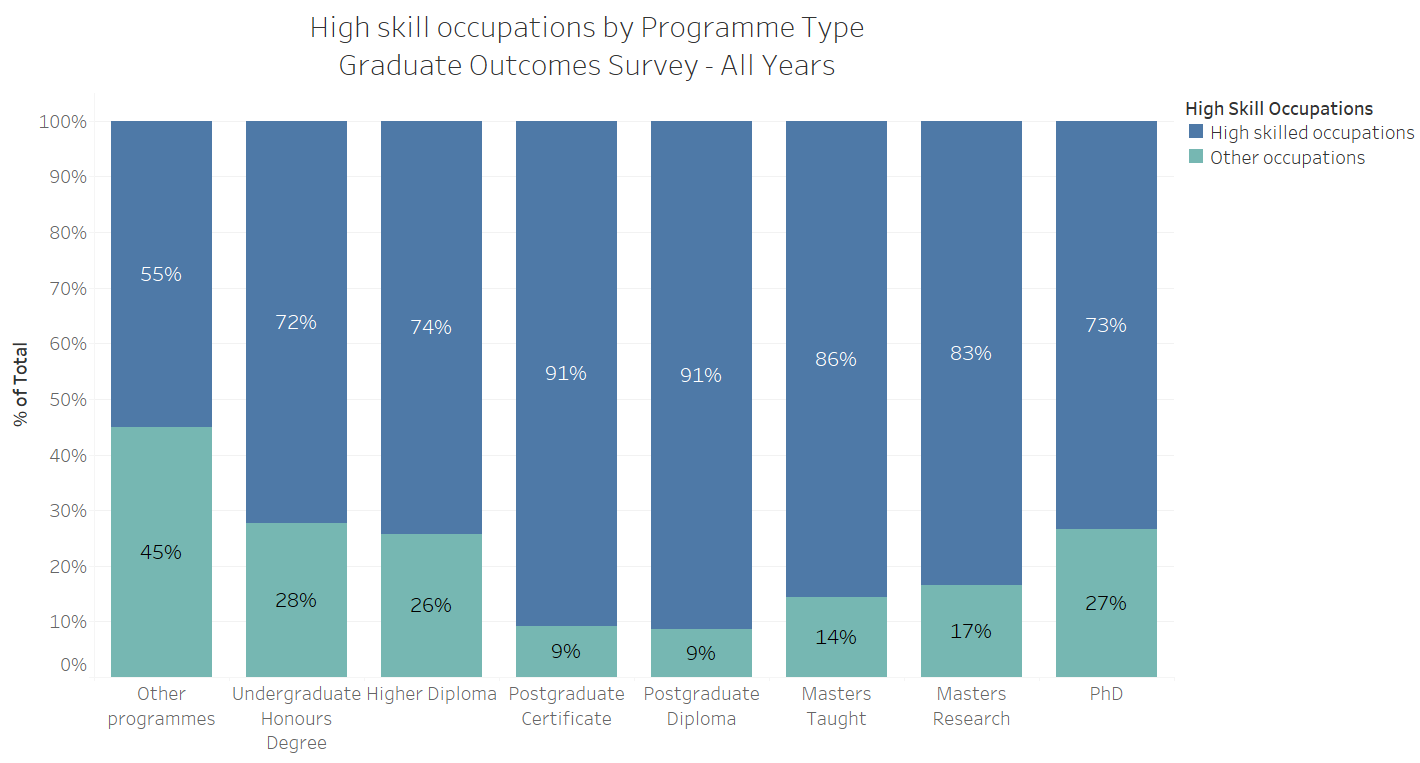
The following chart gives the percentage of graduates who moved directly into high skilled occupations by programme type.
Field of Study
We consider different fields of study in more detail here.
For Arts and Humanities graduates, the distribution of occupations is wider than for other fields of study. A total of 33% entered Professional Occupations. This is followed by 18% in Sales and Customer Service Occupations, 14% in Associate Professional and Technical Occupations and 10% in Administrative and Secretarial Occupations.
This wider distribution of occupations is also seen with graduates of Services programmes, with 22% in Administrative and Secretarial Occupations, 21% in Professional Occupations, 11% in Skills Trades Occupations, 9% in Associate Professional and Technical Occupations, 9% as Managers, Directors and Senior Officials and 9% as Sales and Customer Service Occupations.
For Business, Administration and Law graduates, 43% were employed in the Professional Occupations. This is followed by 16% employed in Associate Professional and Technical Occupations and 12% as Managers, Directors and Senior Officials.
88% of Education graduates were employed in Professional Occupations.
For graduates of Engineering, Manufacturing and Construction, 61% were employed in Professional Occupations, 16% in Associate Professional and Technical Occupations and 7% in Skills Trades Occupations
For Health and Welfare graduates, 68% were employed in Professional Occupations, followed by 14% in Caring, Leisure and Other Service Occupations.
A total of 52% of ICT graduates were employed in Professional Occupations, followed by 28% in Associate Professional and Technical Occupations
For Natural Sciences, Mathematics and Statistics graduates, 52% were employed in Professional Occupations, followed by 22% in Associate Professional and Technical Occupations.
For Social Sciences, Journalism and Information, nearly half (48%) were employed in Professional Occupations, followed by 13% in Administrative and Secretarial Occupations.
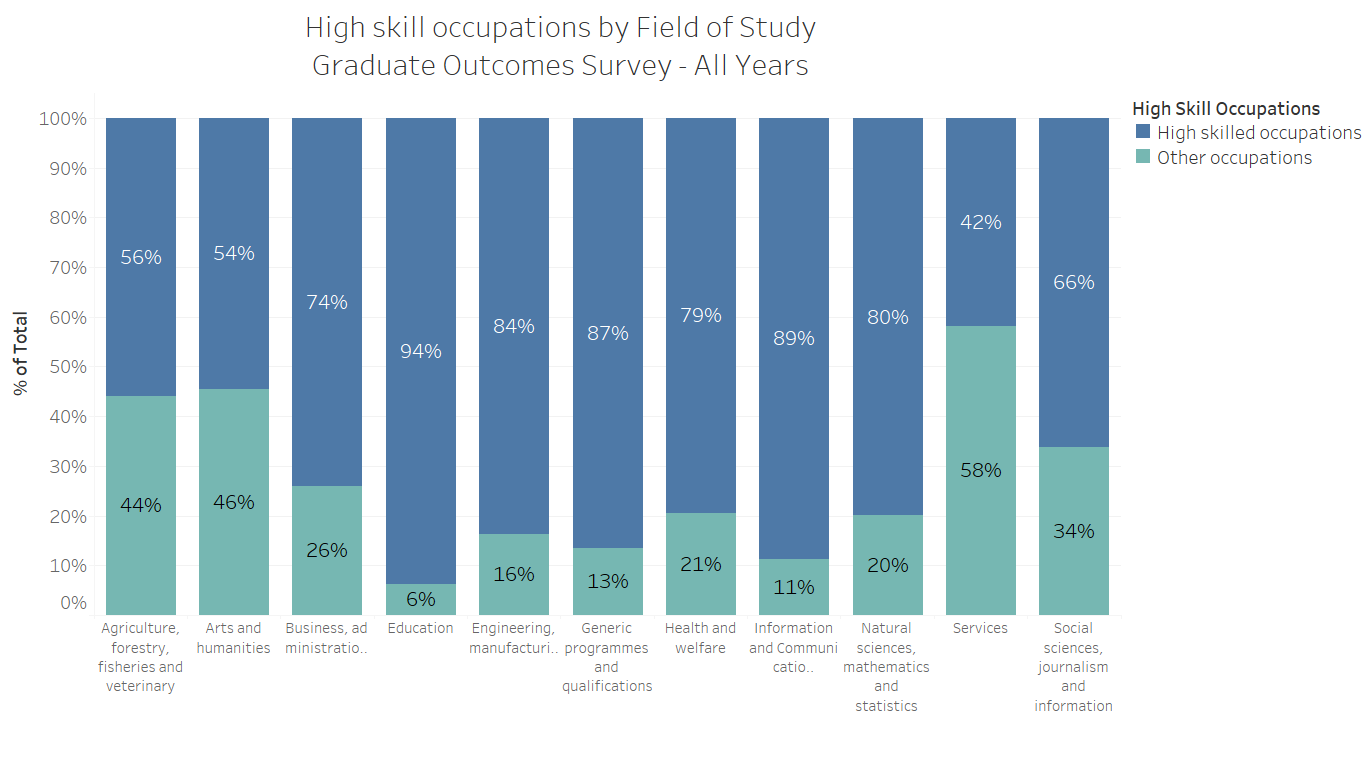
The following chart shows the percentage of graduates entering the three high skilled occupations (Professional Occupations, Associate Professional and Technical Occupations and Managers, Directors and Senior Officials) within nine months of graduation by field of study.
The next section of this report gives a further breakdown of occupations into economic sectors.