
Find information on how to make a Protected Disclosure under the external procedures in place in the HEA.
Find information on how to make a Protected Disclosure under the external procedures in place in the HEA.

INSPIRE is a €750 million investment package that will address research infrastructure needs across the higher education sector while ensuring alignment with national research and innovation priorities.

Tracking graduate outcomes is crucial to improving the quality of education for students and outcomes for graduates.
8. COVID-19 Impact
The impact of COVID-19 has been profound – understanding how different cohorts are impacted is of significant importance. An OECD (2021) report suggests that individuals have been disproportionately affected by the pandemic, with certain sectors suffering more than others.
This chapter seeks to explore the impact of COVID-19 on graduate outcomes, by comparing the Class of 2020 to previous cohorts*:
Overall, the proportion of graduates in employment has decreased, while the proportion in unemployment has increased
In 2017, 78.1% of graduates were in employment nine months after graduation. In 2018, this had increased to 80.1%. In 2020, this has dropped to 75.9%.
In 2017, 4.6% of graduates were unemployed nine months after graduation. In 2018, this had dropped to 4.3%. In 2020, this has increased to 8.1%.
By Programme Type
Undergraduate Honours Degree graduates saw a 5-percentage point decrease in employment, from 74.7% in 2018 to 69.7% in 2020, representing the largest drop in employment for any programme type. The proportion of graduates working part-time remained the same, yet the proportion of graduates working full-time dropped by 6 percentage points (61.2% in 2020; 67.2% in 2018). Meanwhile, the proportion of graduates due to start a job in the next 3 months is 2.4% in 2020, up from 1.4% in 2018.
Masters Taught graduates followed, with a drop of 4.3 percentage points, from 88.1% in 2018 to 83.8% in 2020. The proportion of graduates working part-time dropped slightly (5.6% in 2020; 6.1% in 2018). The proportion of graduates working full-time dropped by 5 percentage points (75.5% in 2020; 80.5% in 2018). Similar to Undergraduate Honours Degree graduates, the proportion of graduates due to start a job in the next 3 months increased to 2.7% in 2020, up from 1.5% in 2018.
Although overall employment dropped, there are instances of improvements amongst some programme types. Improvements in employment prospects are observed amongst Postgraduate Certificate graduates (90.3% in 2020; 83.5% in 2018) and PhD graduates (93.1% in 2020; 89.7% in 2018). It is worth noting that in 2017, 93.5% of PhD graduates were employed nine months after graduation.
Amongst Postgraduate Certificate graduates, the proportion working full-time nine months after graduation increased by 9.7 percentage points (84.6% in 2020; 74.9% in 2018), while the proportion working part-time dropped (5.4% in 2020; 8.1% in 2018). Similarly, the proportion of PhD graduates working full-time increased (85.9% in 2020; 82.0% in 2018), while the proportion working part-time dropped (5.3% in 2020; 7.0% in 2018).
Masters Taught programmes have the highest proportion of graduates in unemployment nine months after graduation, at 10.0% in 2020. Moreover, they have the largest increase in unemployment. The proportion of Unemployed graduates increased by 5.1 percentage points for Masters Taught graduates (10.0% in 2020; 4.9% in 2018). For Undergraduate Honours Degree graduates, unemployment increased by 3.3 percentage points (7.2% in 2020; 3.9% in 2018), and for Higher Diploma graduates, this is 2.5 percentage points (8.7% in 2020; 6.2% in 2018).
Although Masters Taught graduates saw a larger increase in unemployment than Undergraduate Honours Degree graduates, it is worth noting the proportion of graduates pursuing further study. Amongst Masters Taught graduates, the proportion of graduates pursuing further study remained unchanged (4.2% in 2020; 4.0% in 2018), while the proportion of Undergraduate Honours Degree graduates pursuing further study increased by 2.4 percentage points (20.9% in 2020; 18.5% in 2018). Thus, unemployment “prospects” may have been mitigated by graduates turning to further study.
Reasons for Unemployment
Looking at Undergraduate Honours Degree graduates, there is a sharp increase in the proportion of graduates saying, “I have been looking for a job since graduation” (53.9% in 2020; 34.9% in 2018). Meanwhile, there is a drop in the proportion of graduates saying, “I resigned from my job to seek employment elsewhere” (8.7% in 2020; 17.1% in 2018). Similarly, the proportion “travelling but now looking for a job” has dropped (1.8% in 2020; 7.7% in 2018).
For Masters Taught graduates, similar to Undergraduate Honours Degree graduates, there is a sharp rise in the proportion of graduates “looking for a job since graduation” (59.3% in 2020; 49.5% in 2018). Simultaneously, a drop in the proportion of graduates saying, “I resigned from my job to seek employment elsewhere” (6.5% in 2020; 13.0% in 2018).
Undergraduate Honours Degree Graduates
Of the graduates Engaged in Other Activities, 9.5% took time out to travel in 2020. This is down from 23.1% in 2018.
Meanwhile, there is an increase in the proportion of graduates not able to work due to illness or disability (10.6% in 2020; 5.9% in 2018). Similarly, 11.1% of graduates are engaged in home duties in 2020, up from 4.9% in 2018.
Masters Taught Graduates
Similar to Undergraduate Honours Degree graduates, the proportion of Masters Taught graduates taking time out to travel has decreased (3.0% in 2020; 8.3% in 2018).
Again, similar to Undergraduate Honours Degree graduates, the proportion of graduates not able to work due to illness or disability has increased (9.9% in 2020; 4.5% in 2018). The proportion engaged in home duties has also increased (15.9% in 2020; 9.9% in 2018).
By Field of Study
As the largest drops in employment and largest increases in unemployment are observed amongst Undergraduate Honours Degree graduates and Taught Masters graduates, this section will focus solely on these two programme types.
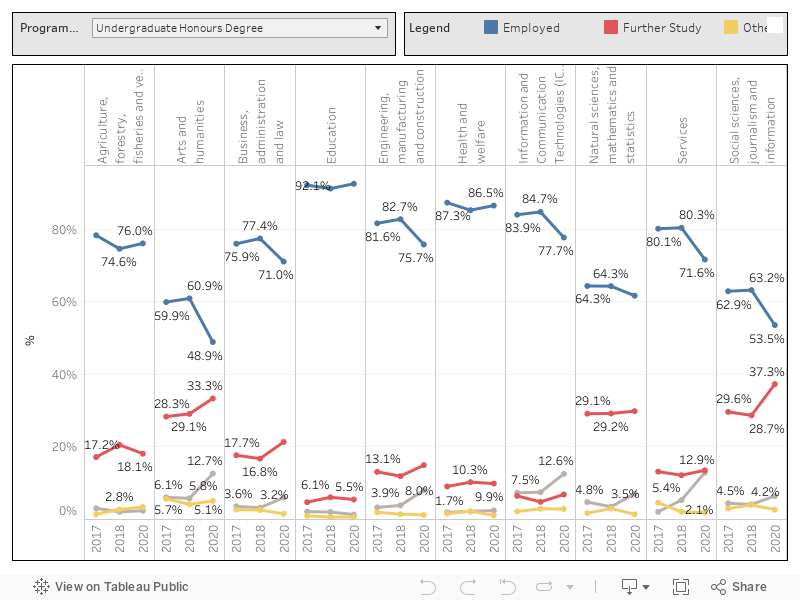
Employment
The largest drop in employment is observed amongst Arts & Humanities graduates, with a 12-percentage point drop (48.9% in 2020; 60.9% in 2018). This is followed by Social Sciences, Journalism & Information, with a drop of 9.7 percentage points (53.5% in 2020; 63.2% in 2018). Moreover, Arts & Humanities and Social Sciences, Journalism & Information had the lowest proportion of graduates in employment nine months after graduation.
For Arts & Humanities graduates, the proportion of graduates working full-time dropped by 10.9 percentage points (36.3% in 2020; 47.3% in 2018). The proportion of graduates working part-time also dropped (10.4% in 2020; 11.7% in 2018). Nonetheless, the proportion due to start a job in the next 3 months increased slightly (2.1% in 2020; 1.9% in 2018).
For Social Sciences, Journalism & Information graduates, the proportion working full-time dropped (41.2% in 2020; 54.1% in 2018), while the proportion working part-time increased slightly (9.9% in 2020; 7.8% in 2018). The proportion due to start a job in the next 3 months also increased slightly (2.4% in 2020; 1.3% in 2018).
Unemployment
Services saw the largest increase in unemployment, at 7.5 percentage points (12.9% in 2020; 5.4% in 2018). This is followed by Arts & Humanities, at 6.8 percentage points (12.6% in 2020; 5.8% in 2018).
Although Social Sciences, Journalism & Information graduates suffered a 9.7 percentage point drop in employment, a sharp increase in unemployment is not observed (6.5% in 2020; 4.2% in 2018). This is partially attributable to the increase in the proportion of graduates pursuing further study (37.3% in 2020; 28.7% in 2018). This represents an 8.6 percentage point increase in the proportion of graduates pursuing further study, and the largest increase for any field of study.
Employment
The proportion of Services graduates in employment nine months after graduation had the largest drop of 11.6 percentage points (82.2% in 2020; 93.8% in 2018). This is followed by Business, Administration & Law, with a drop of 7.4 percentage points (85.1% in 2020; 92.5% in 2018). Amongst Business, Administration & Law, the detailed field of study that saw the largest drop in employment was Finance, Banking & Insurance, with an 11.8 percentage point drop (81.2% in 2020; 93.0% in 2018). Simultaneously, Finance, Banking & Insurance saw the largest increase in unemployment (14.7% in 2020; 3.8% in 2018).
Unemployment
While the proportion of Services graduates in employment dropped, the proportion of graduates in unemployment increased by 9.5 percentage points, representing the largest increase in unemployment by field of study (10.7% in 2020; 1.2% in 2018). This is followed by Arts & Humanities, at 7.8 percentage points (16.3% in 2020; 8.4% in 2020).
Undergraduate Honours Degree Graduates
Overall, the proportion of graduates on Permanent or Open-Ended contracts increased (58.3% in 2020; 55.5% in 2018), while the proportion on Temporary contracts decreased slightly (9.0% in 2020; 9.3% in 2018).
Although the proportion of Education graduates in employment increased (92.5% in 2020; 91.1% in 2018), and the proportion in unemployment decreased (1.4% in 2020; 2.1% in 2018), this is partially attributable to the increase in Temporary employment.
Looking at contract types, 34.8% of Education graduates in 2020 are on Temporary contracts nine months after graduation. This is up from 26.7% in 2018. Meanwhile, the proportion on Permanent or Open-Ended Contracts dropped to 18.1% in 2020, down from 22.2% in 2018.
In Health & Welfare, 63.9% of graduates are on Permanent or Open-Ended contracts in 2020, up from 55.1% in 2018.
Masters Taught Graduates
Similarly, at Masters Taught level, there is an increase in Temporary employment for Education graduates (19.3% in 2020; 14.1% in 2018), and a drop in Permanent or Open-Ended contracts (35.2% in 2020; 43.1% in 2018).
At Undergraduate Honours degree level, there is an increase in the proportion of graduates who had completed Internships (61.6% in 2020; 55.5% in 2018). In contrast, for Masters Taught graduates, there was a slight drop in the proportion of graduates completing Internships (27.2% in 2020; 28.8% in 2018). For Social Sciences, Journalism & Information graduates, 79.3% did not complete an Internship in 2020, compared to 72.8% in 2018.
By Detailed Field of Study
For Undergraduate Honours Degree graduates, Arts & Humanities, Social Sciences, Journalism & Information, and Services graduates are the most impacted, with large drops in employment or large increases in unemployment. As such, the text in this section relates primarily to graduates of these fields of study. However, detailed fields of study are available in the below chart for every field of study. Note that any detailed field of study with less than 20 observations in a year are excluded from the visual.
Arts & Humanities
Within Arts & Humanities, Literature & Linguistics saw the largest drop in employment (39.3% in 2020; 60.6% in 2018), followed by Fine Arts (45.7% in 2020; 63.0% in 2018). Fine Arts also saw the largest increase in unemployment (27.9% in 2020; 10.0% in 2018), followed by Music & Performing Arts (16.6% in 2020; 5.9% in 2018).
Social Sciences, Journalism & Information
By detailed field of study, Political Sciences & Civics saw the largest drop in employment (46.1% in 2020; 61.7% in 2018), followed by Sociology & Cultural Studies (48.1% in 2020; 60.3% in 2018).
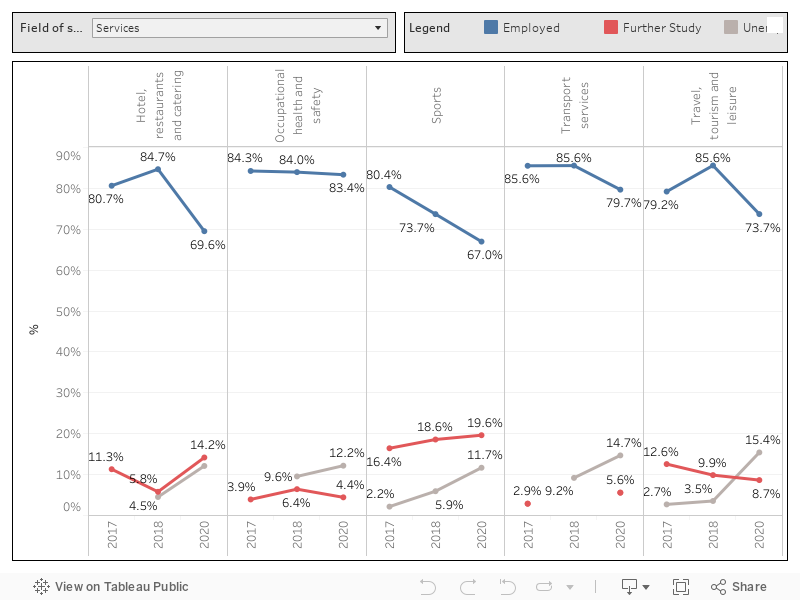
Services
Amongst Services, by detailed field of study, the largest increase in unemployment is observed for Travel, Tourism & Leisure graduates (15.4% in 2020; 3.5% in 2018), followed by Hotel, Restaurants & Catering (12.1% in 2020; 4.5% in 2018).
By Gender
Gender
Overall, males saw a larger drop in employment than females, at a drop of 5.5 percentage points (69.6% in 2020; 75.1% in 2018) versus a drop of 4.7 percentage points (69.7% in 2020; 74.4% in 2018). Consequently, males saw a larger increase in unemployment (8.6% in 2020; 4.8% in 2018) than females (6.2% in 2020; 3.2% in 2018).
Nonetheless, as observed above, the field of study has a large role to play in determining employment or unemployment prospects. As such, a comparison of outcomes by field of study and gender is warranted. The below section focuses solely on the fields and detailed fields of study most impacted.
Gender by detailed field of study
Looking at Hotel, Restaurants & Catering within Services, females experienced a larger drop in employment (63.9% in 2020; 81.1% in 2018) than males (78.8% in 2020; 90.1% in 2018). Simultaneously, females saw a larger increase in unemployment (15.7% in 2020; 5.0% in 2018) than males (6.2% in 2020; 3.8% in 2018). This is despite a large increase in the proportion of females pursuing further study.
Similarly, in Travel, Tourism & Leisure, females experienced a larger drop in employment (71.3% in 2020; 83.9% in 2018) than males (79.7% in 2020; 90.2% in 2018), while females saw a larger increase in unemployment (18.6% in 2020; 2.7% in 2018) than males (7.6% in 2020; 5.8% in 2018). Nonetheless, the proportion of males going into further study increased (12.7% in 2020; 3.9% in 2018) compared to females (7.0% in 2020; 12.1% in 2018). Thus, a large increase in unemployment amongst males may have been mitigated by the increase in the number of graduates pursuing further study.
In Literature & Linguistics, males experienced a large drop in employment (32.2% in 2020; 56.3% in 2018). This drop of 24.1 percentage points is slightly better than the drop of 20.5 percentage points amongst females (41.6% in 2020; 62.1% in 2018). Consequently, unemployment increased sharply for males (23.3% in 2020; 1.3% in 2018), compared to females (6.4% in 2020; 1.6% in 2018). The smaller drop in unemployment observed amongst females is partially attributable to the large increase in females pursuing further study (43.9% in 2020; 31.8% in 2018), compared to males (39.2% in 2020; 40.7% in 2018).
Note that numbers are too low in some fields to provide a detailed analysis. Nonetheless, it is worth noting that there are other factors that may be impacting the proportion of females or males in employment or unemployment, other than field of study, such as occupation or sector choice.
For more comparisons across years, click the link below to visit the All Years dashboard.
* Note that previous cohorts include the Class of 2017 and 2018 only. The Class of 2019 data is unavailable, as the timing of the survey coincided with the sudden onset of COVID-19. To minimise the burden on students and institutes alike, the decision was made to cancel the Class of 2019 Graduate Outcomes survey.
Note: filtering can result in a low number of graduates that fit specific criteria. Any criteria that result in less than five graduates being represented are excluded from the graphs in this report. Nonetheless, the Total provided will be inclusive of any excluded fields.