Find information on how to make a Protected Disclosure under the external procedures in place in the HEA.
Find information on how to make a Protected Disclosure under the external procedures in place in the HEA.

INSPIRE is a €750 million investment package that will address research infrastructure needs across the higher education sector while ensuring alignment with national research and innovation priorities.

Tracking graduate outcomes is crucial to improving the quality of education for students and outcomes for graduates.
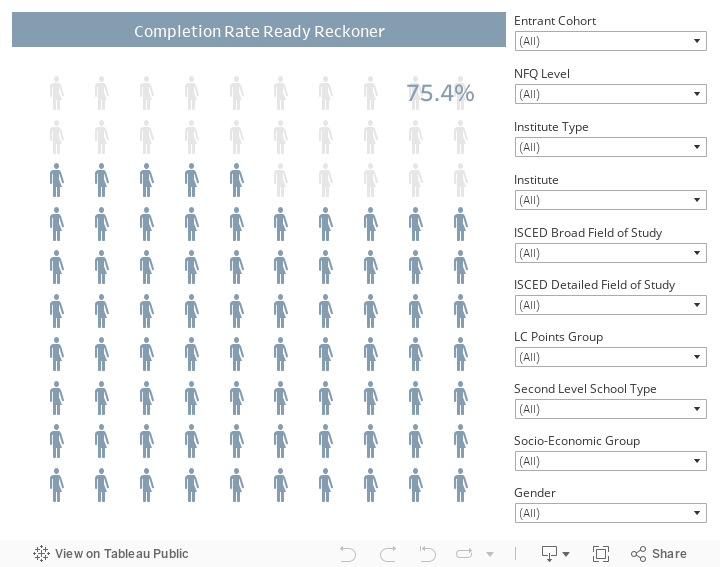
Completion Analysis – 2008/09, 2009/10 & 2010/11 Entrants
3 of every 4 undergraduate entrants complete and graduate, based on a detailed analysis of completion rates for 2008/09, 2009/10 and 2010/11 entrants to higher education.
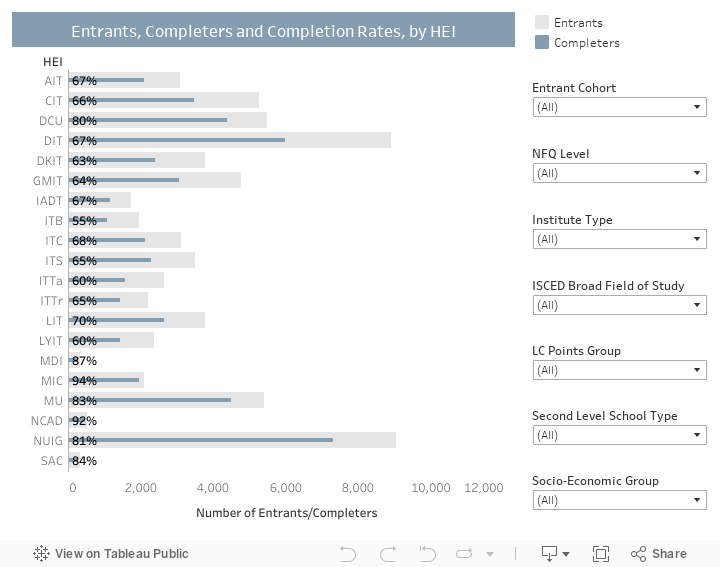
However, completion rates vary substantially across sectors, institutes, fields of study and student cohorts. At sector level: Colleges, mainly comprised of teaching trainees, have the highest completion rates at 93%-94%. University rates are steady at 83% across all three entrant cohorts. Rates are lower in Institutes of Technology (65%-66% across the three cohorts), particularly at NFQ levels 6 and 7 (60%-62%).
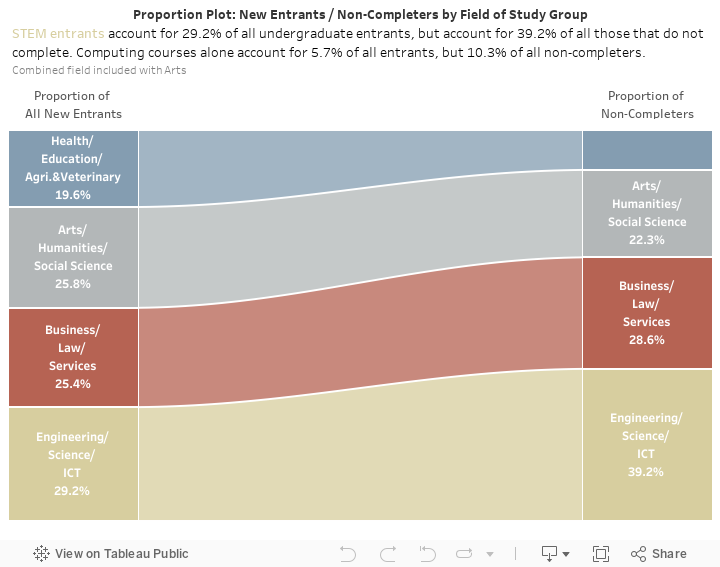
The computing field of study continues to have the lowest rates of completion overall, with rates nationally between 55%-56% for the cohorts in this analysis.
Rates of completion in the education field of study are highest across all three cohorts, ranging from 92%-94%, albeit the rates decrease 1 percentage point for each subsequent cohort.
The other fields with particularly low completion rates are engineering, manufacturing and construction and services. The other fields with particularly high completion rates are health and welfare, social sciences and agriculture & veterinary.
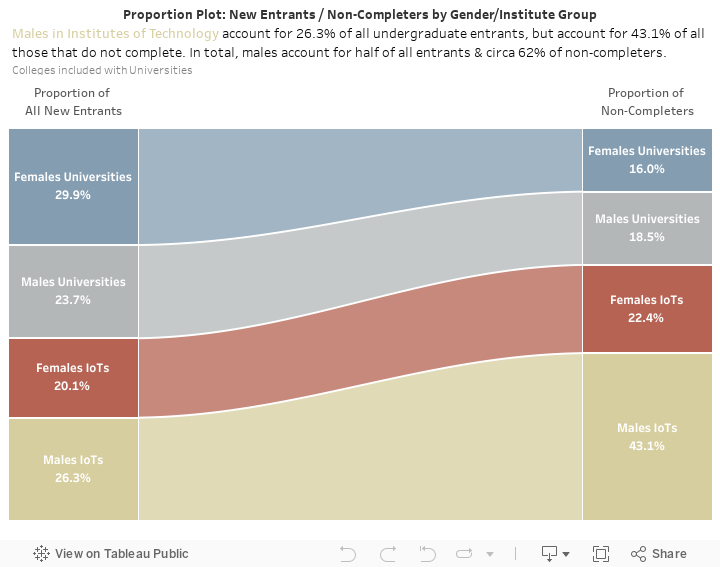
There is a substantial difference in completion rates by gender. For all three entrant cohorts combined, the female completion rate is 81.1%, compared to 69.7% for males – a gap of over 11 percentage points. Females outperform males on average across most fields of study, in terms of both completion rates and final grades.
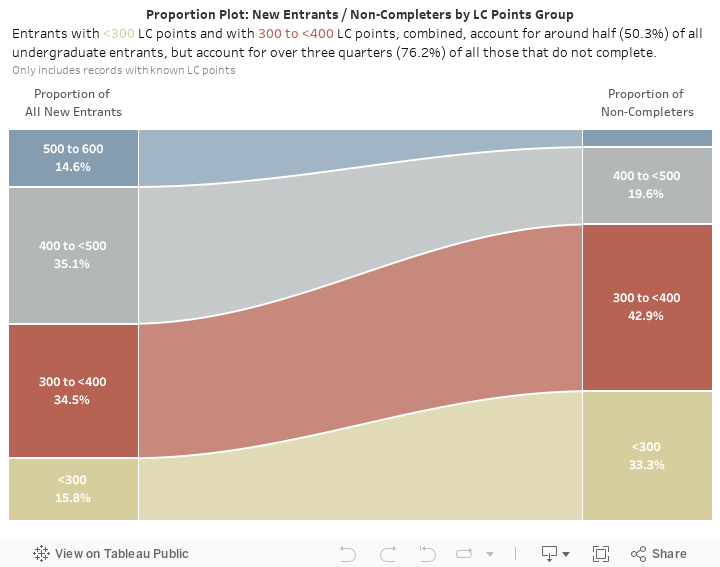
The key factor driving differences by gender and in general across the system, is Leaving Certificate points at entry. High Leaving Certificate points at entry are associated with a high probability of completion, low points at entry are associated with a low probability of completion. Less than half (49%) of those that enter with under 300 LC points complete, compared with 93% of those that enter with over 500 points.
In addition to Leaving Certificate points, grades in Leaving Certificate Mathematics and English are found to be strong predictors of performance in higher education.
Although headline completion rates are lower for those from lower SES backgrounds and for those for DEIS schools, multivariate models show that Leaving Certificate points largely drive these differences and once accounted for, performance for such students compares favourably. In the case of students from DEIS schools, they outperform those from grind schools, on average.
Rates of progression to postgraduate level are relatively low in Institutes of Technology (3% progress to NFQ level 9 internally across the sector). Across the Universities, 18% progress internally to NFQ level 9. NUI Galway has the highest proportion of entrants that go on to level 9 internally (25%). Trinity College Dublin has the lowest proportion (7%).
Of the initial almost 28,000 non-completers, over 17% go on to graduate in another Irish HEI in the following years. However, this proportion varies considerably across sectors/HEIs (26% for Universities, 13% for Institutes of Technology) and LC points (9% for those with <300 points compared to 40% for those with >500 points).