
Find information on how to make a Protected Disclosure under the external procedures in place in the HEA.
Find information on how to make a Protected Disclosure under the external procedures in place in the HEA.

INSPIRE is a €750 million investment package that will address research infrastructure needs across the higher education sector while ensuring alignment with national research and innovation priorities.

Tracking graduate outcomes is crucial to improving the quality of education for students and outcomes for graduates.
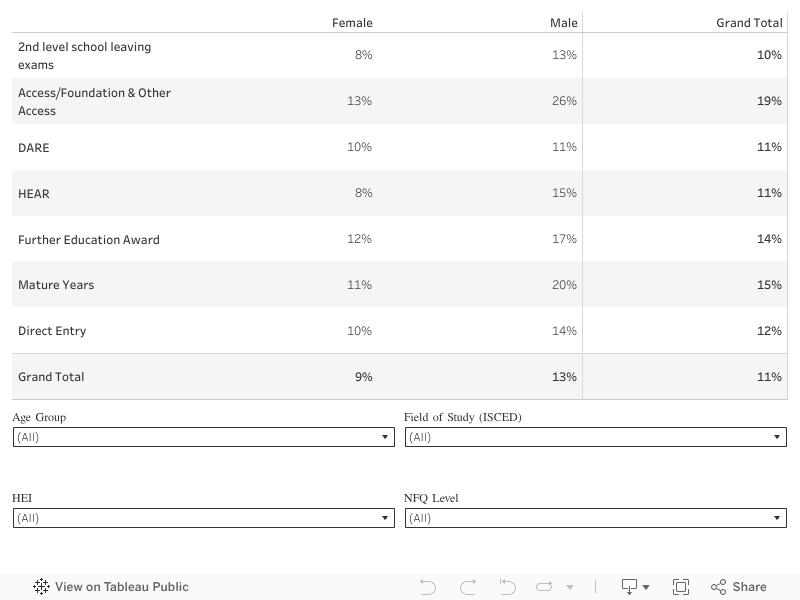
Previous progression analyses suggested a relationship between academic preparedness and non-progression. Therefore this section looks at non-progression rates by prior education, both in terms of entry basis and then for leaving certificate attainment for the relevant cohort. Since 2018/2019, the HEA has collected the entry basis of students as part of the SRS returns process. Entry basis in this context is the primary basis on which students are accepted onto their courses, for example, school leaving exams (leaving cert) or on the basis of a Further Education award.
In addition, Leaving Cert data is submitted to the HEA as part of the SRS returns and we have a separate section for this cohort. The majority of students (73% in 2022/2023) enter higher education on the basis of leaving certificate points. Additionally, 6% enter through the DARE scheme while 4% enter via HEAR (both 2022/2023) (see this page for further information on the HEAR and DARE schemes).
Please note, in the interactive tables on this and the previous section, non-progression rates are not shown in cells where the numbers of students are less than 25. In the case of socio-economic breakdown (DIS) and SUSI Grant holders (previous page), as well as all entry basis the threshold is 100. This is in line with our statistical disclosure policy.
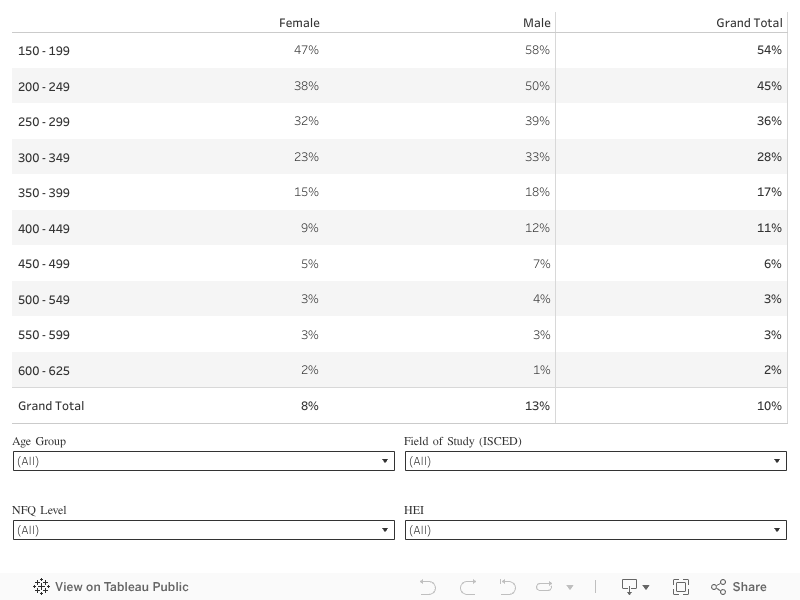
There is a particular focus on Leaving Certificate points in the progression analysis as the data allows this more granular analysis of prior educational attainment than is available with other entry routes. Both previous years headline rates, and the findings of regression analyses suggested a relationship between Leaving Cert points and non-progression:
The majority of students do progress, regardless of entry route or prior educational attainment. While, in general, those with higher leaving cert points tend to have higher rates of progression, nearly 50% of entrants with the lowest level of points progress to the following year.
Average LC Points Attained on entry by students who progressed or did not progress (Second level school exams entry basis only)
There is an average of about 88.1 points difference overall between those who progressed and those who didn’t. However, this difference will vary by level, field of study and other factors.
For example, the following is the breakdown of average LC points attained by entrants to courses at Levels 6,7 or 8 over the years 2018/19 to 2022/23:
| Progressed | 2018/2019 | 2019/2020 | 2020/2021 | 2021/2022 | 2022/2023 | Average for Period |
| Progressed | 428.5 | 430.8 | 455.4 | 484.2 | 479.3 | 456.1 |
| Not Progressed | 341.5 | 342.3 | 367.9 | 388.7 | 381.3 | 368.0 |
| Grand Total | 420.5 | 425.0 | 446.9 | 472.6 | 469.6 | 447.7 |
There is an average of about 88 points difference overall between those who progressed and those who didn’t. However, this difference will vary by level, field of study and other factors.
For example, the following is the breakdown of average LC points attained by entrants to courses at Levels 6,7 or 8 over the years 2018/19 to 2022/23:
| NFQ Level | Not Progressed | Progressed | Grand Total | Difference |
| Level 6 | 268.1 | 325.8 | 314.6 | 57.6 |
| Level 7 | 287.4 | 325.7 | 316.4 | 38.3 |
| Level 8 | 402.6 | 470.8 | 465.6 | 68.2 |
| Grand Total | 368.0 | 456.1 | 447.7 | 88.1 |