Find information on how to make a Protected Disclosure under the external procedures in place in the HEA.
Find information on how to make a Protected Disclosure under the external procedures in place in the HEA.

INSPIRE is a €750 million investment package that will address research infrastructure needs across the higher education sector while ensuring alignment with national research and innovation priorities.

Tracking graduate outcomes is crucial to improving the quality of education for students and outcomes for graduates.
for
Ireland’s publicly-funded Higher Education Institutions
A. Questions about enrolled students
2. Who were these enrollees, and how have student demographics changed over time?
3. Where are students enrolled and how has this changed over time?
4. What are students studying?
5. What are key trends from the Equal Access Survey?
6. What percent of students receive support from a Student Universal Support Ireland (SUSI) grant?
B. Questions about graduates
1. How many graduates were there in the Class of 2024 and how does this compare to previous years?
2. Who were these graduates, and how have graduate demographics changed over time?
3. Where were graduates enrolled and how has this changed over time?
5. What grades did honours degree graduates earn?
C. Appendix
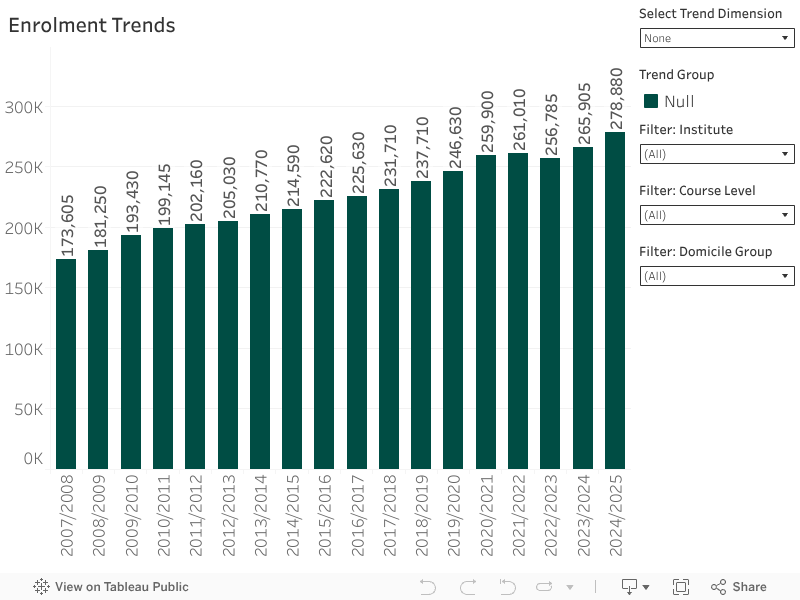
Total Enrolment: There were a total of 278,880 student enrolments across all modes of study in 2024/25. This represents an increase of 4.9% from the 265,905 student enrolments in 2023/24 and is the largest percent enrolment increase since 2020/21. Since 2007/08, when HEA records included all current HEA-funded Universities, Technological Universities, Institutes, and Colleges, student enrolments have increased 57.1% (excluding NCI as their enrolment records begin only in 2023/24).
Course Level: The number of undergraduate students increased 4.1% to 212,345 enrolments in 2024/25. Meanwhile, the number of postgraduate students increased 7.6% to 66,535 enrolments. Postgraduates make up an increasing percent of total enrolments, rising from 17.8% in 2007/2008 to 23.9% in 2024/25. International students were almost evenly split between undergraduate studies (51.3%) and postgraduate studies (48.7%)
Mode: Most students studied full-time (77.3%). The percent of students studying part-time decreased 8.9% in 2024/25 from 2023/24, while the percent of students studying in other ways increased by 48%, from 15,935 in 2023/24 to 23,580 in 2024/25. The majority of this increase was driven by e-learning enrolments.
Programme Type: The most common programme type remained the undergraduate honours degree, with 164,730 (59.1%) of all enrolments in 2024/25. This was 3.7% higher than the previous academic year. While the number of students in the undergraduate honours degree has been rising steadily since 2007/08, the number of students enrolled in an undergraduate general degree has declined for the 14th consecutive year. For postgraduate students, the most common programme type is the taught masters, which increased 9.8% from 31,170 enrollees in 2023/24 to 34,235 in 2024/25. There was also a 12.7% year-on-year increase in the number of students enrolled in a certificate programme, with 17,220 enrollees in 2024/25.
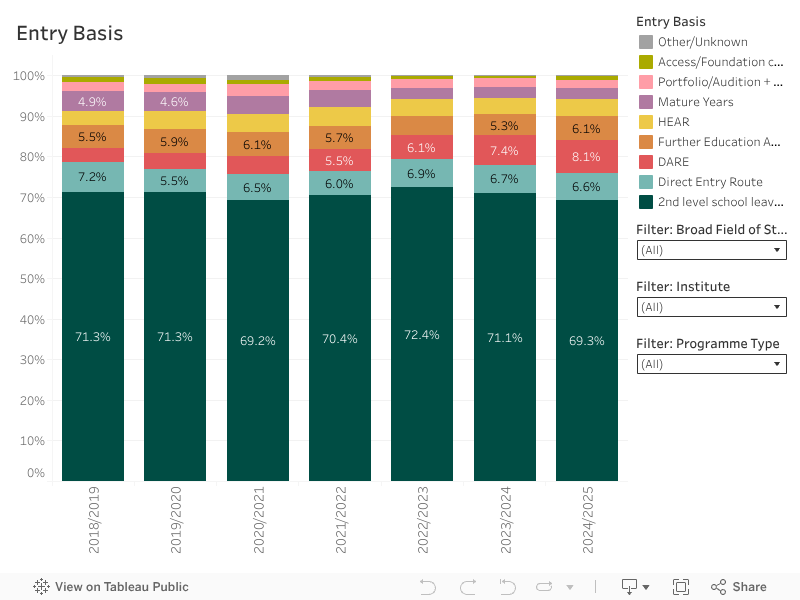
New Entrant: The number of new entrants to full-time, undergraduate higher education in 2024/25 was 48,485. This is up from 48,280 new entrants in 2023/24, representing an increase of 0.4%. The number of enrollees who were not new entrants increased 5.9% from 217,630 in 2023/24 to 230,395 in 2024/25.
The following chart shows the entry basis for new entrant students. Note that students may qualify to enter higher education by multiple pathways, but only select one as their primary entry basis. For most students (69.3%), the primary entry basis was their second level school leaving exams in 2024/25. This was followed by the Disability Access Route to Education (DARE) at 8.1%. This is the highest percent since entry basis has been recorded (2018/19). More details about disability enrolments can be found in section A.5.
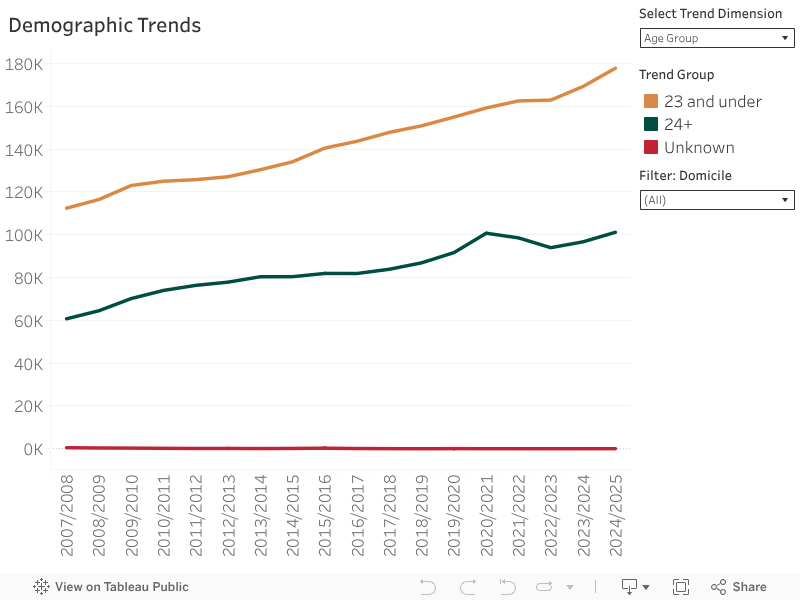
Age Group: The median age of enrolled students was 23 years old. The number aged 23 and under increased 5.0% from 2023/24 to 177,710 in 2024/25; likewise, the number of mature students aged 24+ increased 4.6% to 101,100. The relative proportion of the two age groups has remained similar over time. Since 2007/08, the percent of 23 and under students has ranged from 61.2% (2020/21) to 64.7% (2007/08).
County: Most Irish students were residents of county Dublin prior to beginning their academic course. The 62,755 Dublin county enrollees constituted 22.5% of the total Irish enrolment. The percent of Irish students with a domicile in county Dublin has remained fairly stable since 2007/08, ranging from 21.4% in 2019/20 to 25.7% in 2008/09.
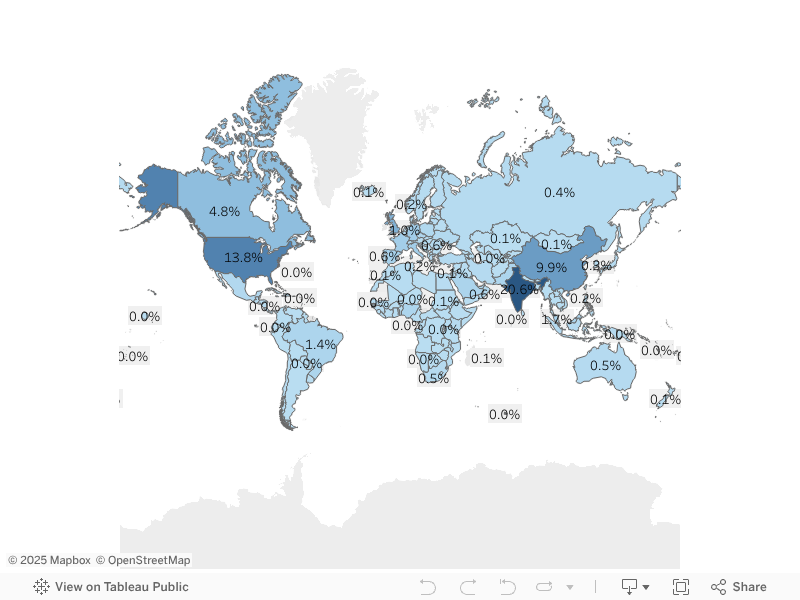
Domicile Group: The total number of Irish enrollees increased 3.9% from 2023/24 to 234,340 in 2024/25. Irish enrollees represented 84% of total enrolments. This is the lowest percent of Irish enrollees in the displayed time-frame (2007/08+). The number of non-IE domiciled enrolments in 2024/25 was 44,535, a rise of 10.2% compared to the previous year. Non-EU enrolments account for the majority of non-IE domiciled enrolments, with 32,940 enrolments. The following map details the percent of enrolees by international domicile. The three most common domiciles of non-IE domiciled students in 2024/25 were India (20.6%), the US (13.8%), and China (9.9%).
Gender: Since 2007/08, there have been more females than males studying each academic year. This gender gap approached parity in 2012/13 and 2013/14, but has largely widened since then. These overall dynamics are most strongly driven by Irish-domiciled students (see filter Domicile: Ireland).
In 2024/25, the number of total female students was 152,245 (54.6% of all students), compared to male enrolment of 124,945 (44.8% of total). This is consistent with data from countries within the Organization for Economic Cooperation and Development, which has documented that females made up 54% of first-time new entrants to tertiary education from 2013 to 2023.
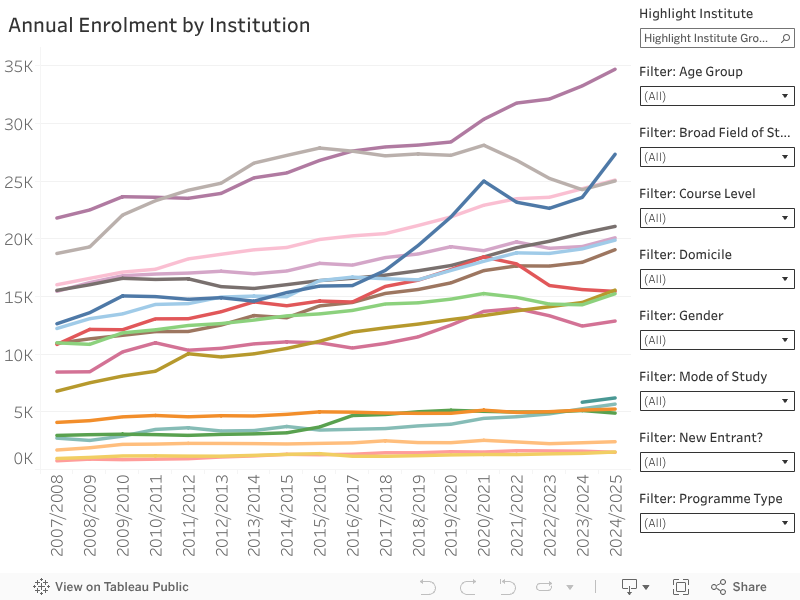
Total Enrolment: UCD had the largest overall enrolment in 2024/25, with 34,715 students. Of the four largest institutions by enrollees, two are universities (UCD and UCC) and two are technological universities (TU Dublin and ATU).
New Entrant: TU Dublin had the largest number of new entrant students, at 5,315.
International Enrolment: International students enrolled most commonly in UCD (7,985) and TCD (6,945), followed by UCC (4,585) and University Galway (4,065). All four institutions have seen increasing international enrolment since academic year 2020/2021.
Changes in Total Enrolment: Most institutions reported increased enrolment. ATU saw the largest percent increase in students, at 15.9%, compared to 2023/24. This was driven by:
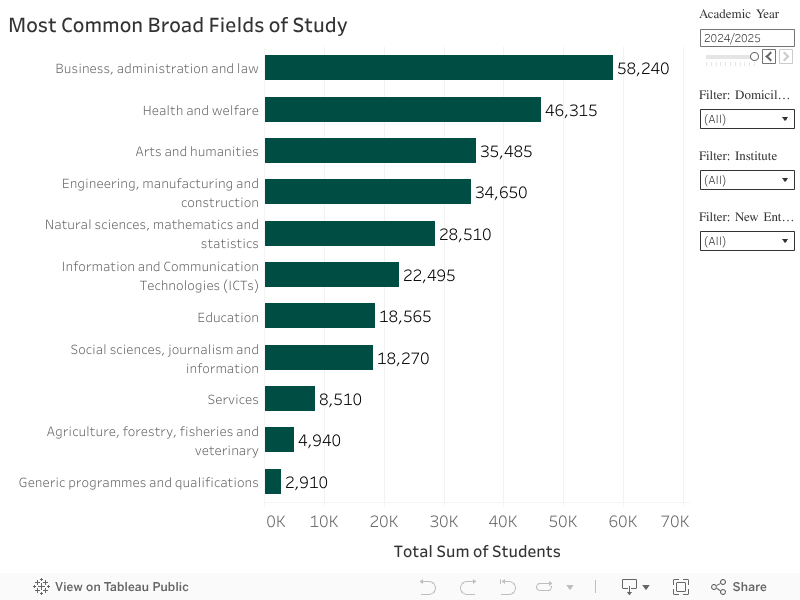
Most Common Fields of Study: The top 5 most common broad fields of study have held the same relative position since 2014/2015. The most common broad field of Business, Administration and Law had 58,240 enrolments in 2024/25, accounting for 20.9% of total enrolments. This is up from 54,205 (20.4% of total) enrolments in 2023/24. The breakdown of detailed fields of study can be seen by hovering over each broad field.
The most common broad fields differed for the two highest-enrolling universities (UCD, UCC) compared to the two highest-enrolling technological universities (TU Dublin, ATU). For UCD and UCC, the most common broad field was Health and Welfare, followed by Business, Administration, and Law. For TU Dublin and ATU, the most common broad fields were Business, Administration, and Law, followed by Engineering, Manufacturing, and Construction.
New Entrant: New entrant students enrolled preferentially in Business, Administration, and Law across all institutions. This was followed by Arts and Humanities (2), Health and Welfare (3), and Engineering, Manufacturing, and Construction (4).
Changes in Enrolment: All broad fields except Education showed increased enrolments in 2024/25 compared to the previous year. Education declined 1% from 18,795 to 18,565 students, but has had more than 18,000 students annually since 2021/22.
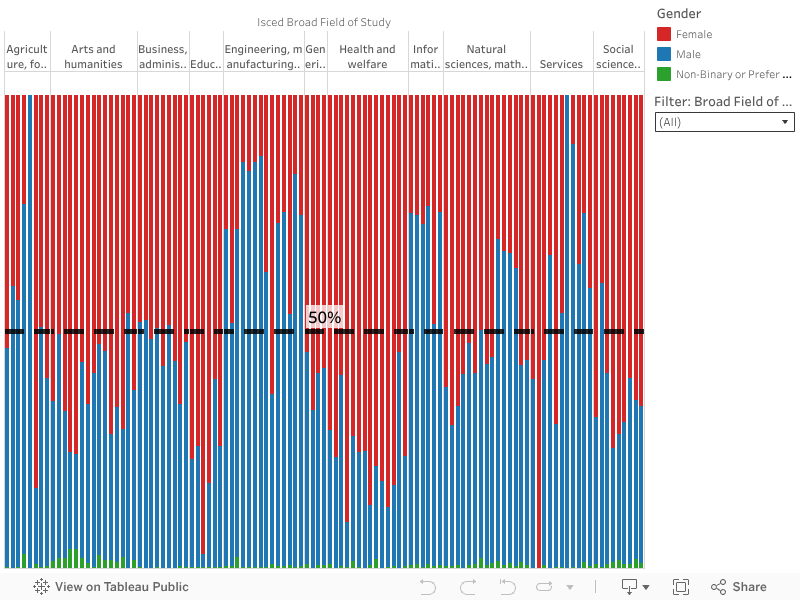
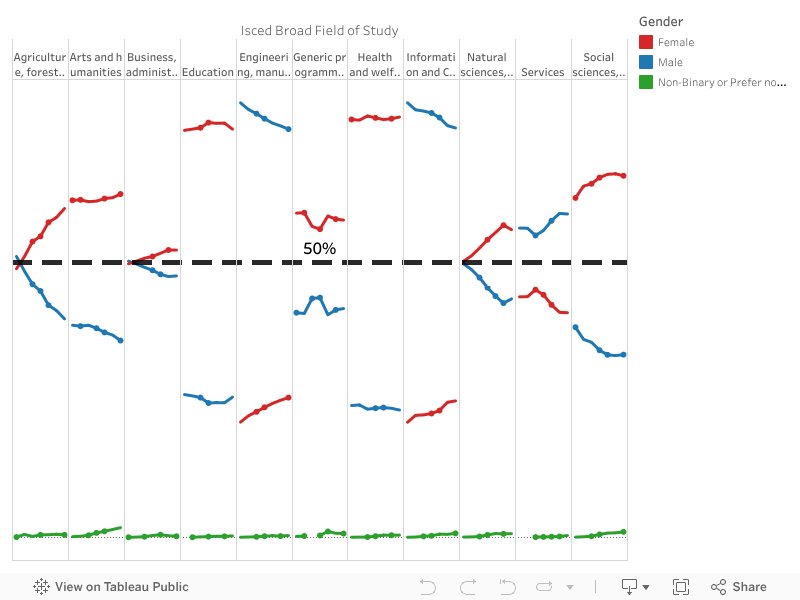
Gender Differences: The first figure below depicts the relative percent of genders in different broad and narrow fields of study. There is a far greater percent of males in both Engineering, Manufacturing, and Construction, as well as Information and Communication Technologies. Conversely, females represent a much greater percent than males in Health and Welfare, as well as Education.
The second figure below shows how gender representation in broad fields of study have changed since the 2018/19 academic year. In the two male-dominated fields noted above, both have seen an increasing percent of females in the field. In the two female-dominated fields, the percent of males has not notably changed. NB: To explore further, see the Fields of Study By Gender Dashboard in the Appendix.
The Equal Access Survey is an annual, voluntary set of questions asked of all first-year undergraduate students to HEA-funded institutions. The questions are asked as part of the registration process at the start of the academic year. In 2024/25, 37,958 new entrant students students responded. The new entrant response rate was 78.3%. The figures below depict trends in the distribution of ethnicity and disability among survey respondents.
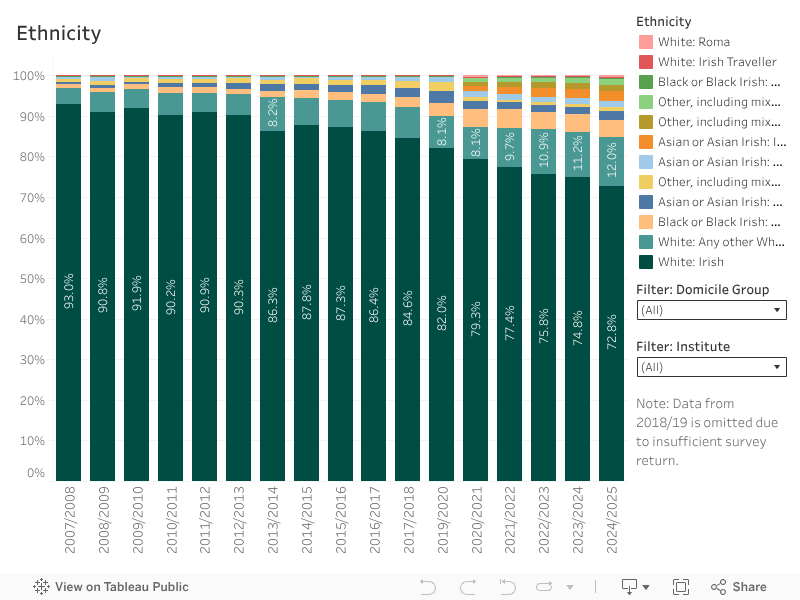
Academic Year 2024/25 had the most diverse enrolment on record. The percent of White Irish enrolments continued to decline, with 72.8% of enrolments in 2024/25 compared to 93.0% in 2007/08. Amongst Ireland-domiciled enrolments, the percent of White Irish similarly declined, to 78.4% of enrolments in 2024/25. These declines reflect the increase in diversity in Ireland, as well as increasing numbers of international students (see section A.2).
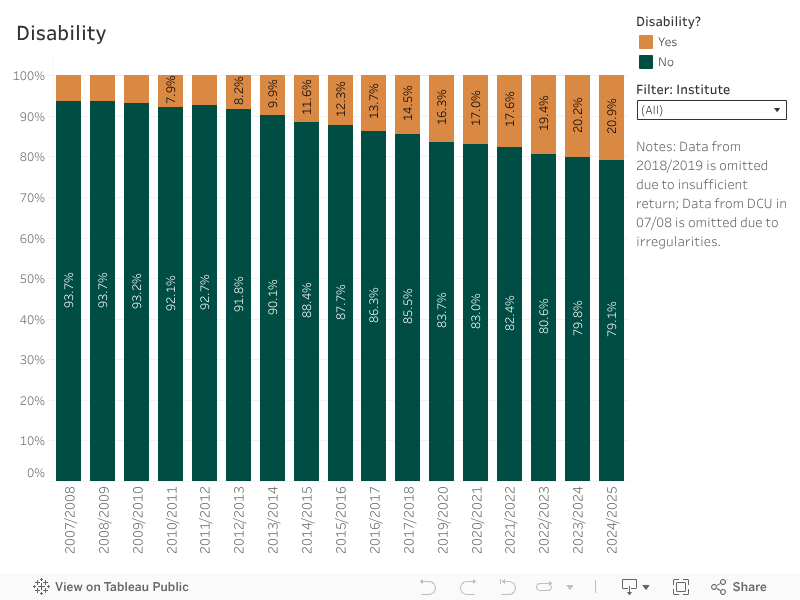
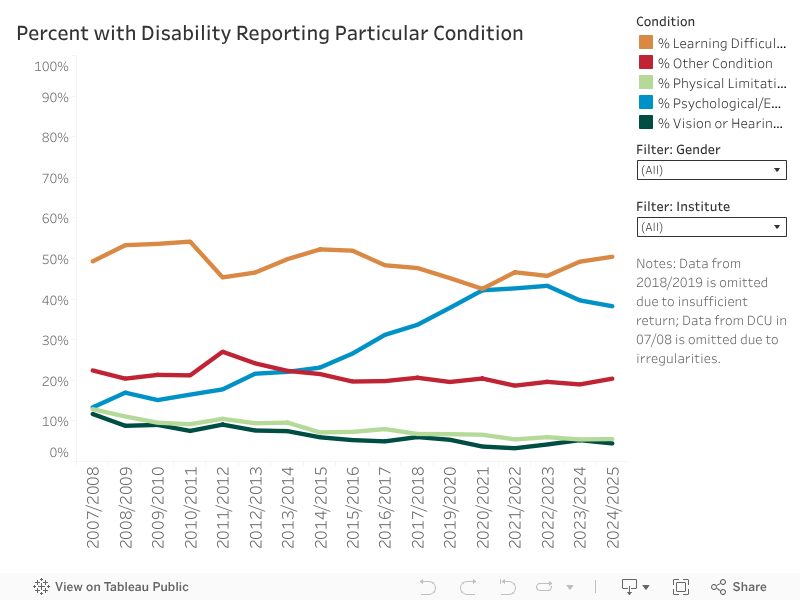
An increasing percent of respondents reported a disability between 2007/08 (6.3%) and 2024/25 (20.9%). The figure below breaks down the types of disability reported. Learning difficulties (50.4%) and psychological or emotional conditions (38.2%) were the two most commonly indicated conditions amongst those with a disability. The percent reporting a psychological or emotional condition has increased substantially from 2007/08 (13.3%) to 2024/25 (38.2%), with a peak coinciding with COVID-19 from 2020/21 through 2022/23. There are also notable gender differences in the top two disability conditions. In 2024/25, a nearly equal percent of females with a disability reported a learning difficulty (44.5%) or psychological or emotional condition (44.4%). In contrast, males with a disability were much more likely to report having a learning difficulty (59.8%) than a psychological or emotional condition (27.0%). In addition, a very large percent of those identifying as non-binary, or preferring not to disclose their gender, reported a psychological or emotional condition (79.5%).
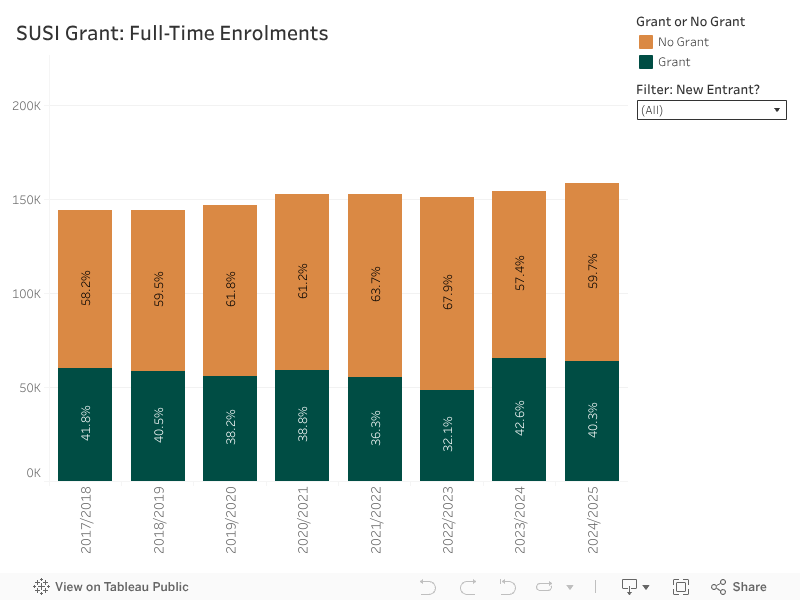
SUSI recipients are primarily domiciled in Ireland (98%+ across all years shown), enrolled as undergraduates (94.9%+), and studying full-time (99.6%). This high-level overview is therefore restricted to these Irish undergraduate full-time students. More detailed analyses of student grant recipients in 2017/18 through 2022/23 can be found in the HEA-SUSI collaborative data analysis. See also eligibility criteria for a SUSI grant.
In 2024/25, 40.3% of full-time Irish undergraduate students received a SUSI grant. This percent has ranged from 32.1% in 2022/23 to 42.6% in 2023/24. Of these students who were new entrants, 42.6% received a SUSI grant in 2024/25.
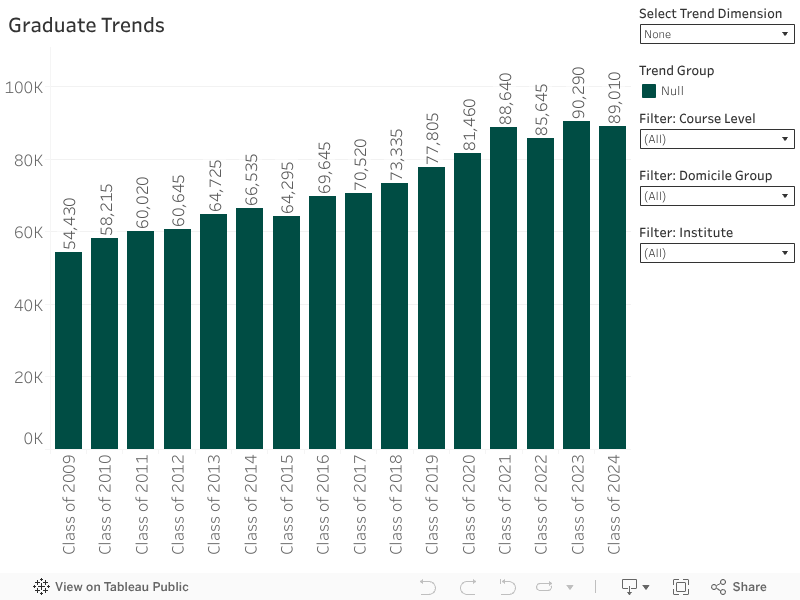
Total Graduates: In the Class of 2024, there were 89,010 graduates. This is the second largest graduating class on record, second only to the Class of 2023, which had 1.4% more graduates (90,290).
Award Type: Most undergraduate students graduated with an honours degree (35,855 graduates representing 64.6% of total undergraduate awards). The percent of undergraduate awards that are certificates continues to rise (19.5% in the Class of 2024), though slightly fewer undergraduates completed a certificate in 2024 (10,845) compared to 2023 (10,915). The number and percent of ordinary degrees continues to decline, with 4,620 being awarded in 2024, down 7.9% from 2023.
Most postgraduate students graduated with a taught masters degree. The Class of 2024 was awarded the most number of taught masters to date, with 20,265 graduates, and the share of taught masters relative to other award types has increased from 51.5% in the Class of 2009 to 60.5% in the latest class. The number of postgraduate diplomas has increased modestly from 5,340 in 2023 to 5,555 in 2024. These diplomas were awarded to 16.6% of graduates in 2024, making it the second most commonly awarded postgraduate credential.
Course Level: Of the total graduates in the Class of 2024, 33,485 were at the postgraduate level. This is the largest number of graduates at this level. Postgraduates have made up an increasing percent of total graduates, with 37.6% of graduates in the Class of 2024 compared to 26.8% in the Class of 2008. There were 3.6% fewer graduates at the undergraduate level in the Class of 2024 than in the Class of 2023. Since the Class of 2020, the number of undergraduate graduates has alternately increased and decreased annually. These fluctuations may reflect COVID-related disruptions, which began in the 2019/2020 academic year.
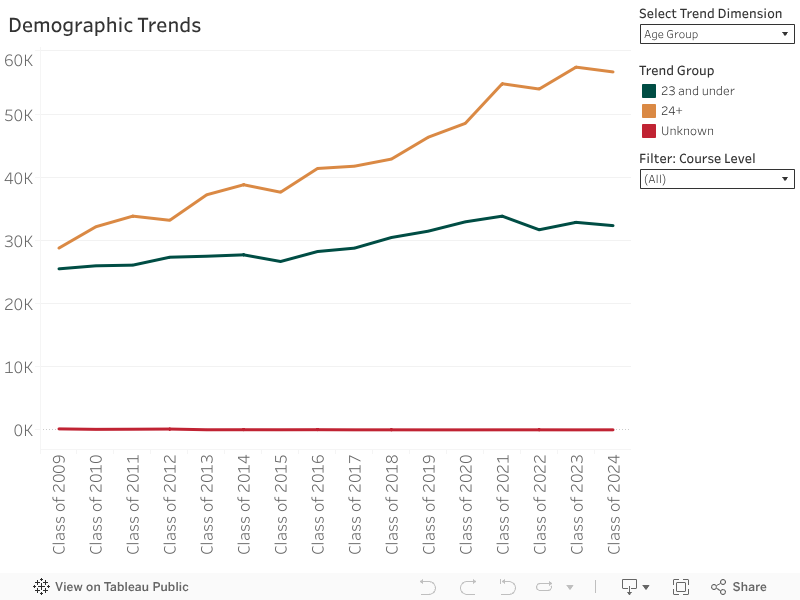
Age Group: Since the Class of 2008, when the percent of graduates aged 23 and under (49%) was close to the percent of those aged 24 and above (50.9%), an increasing proportion of graduates have been 24 or older. In the Class of 2024, 56,670 (64.7%) of graduates were 24 and above, compared to 32,335 (36.3%) who were 23 and below. This aging of graduates is largely attributable to the increasing percent of postgraduates, as detailed in the previous section (see also Filter: Course Level for Postgraduates).
County: Just over one-fifth (21.1%) of Irish-domiciled graduates were from Dublin county in the Class of 2024. This closely mirrors the percent of enrolments from county Dublin (see section A.2), which accounted for 22% of enrolments since academic year 2020/21.
Domicile Group: Irish graduates constituted 82.5% of total graduates in the Class of 2024. The number of Irish graduates (73,465) is down 2.9% from the Class of 2023. This may be attributable to declines in Irish enrolments in 2021/22 and 2022/23, following a peak in enrolments in the first academic year following the onset of COVID-19 (2020/21).
The number of Non-EU graduates increased 11.5% from 2023, with 12,115 graduates in the Class of 2024. This follows the increasing Non-EU enrolments noted in section A.2.
Gender: The gender gap in graduates is somewhat larger than that seen in enrolments. In the Class of 2024, 56.9% (50,675) graduates were female, compared to 42.6% (37,960) male graduates. This gap has slowly widened since the Class of 2015.
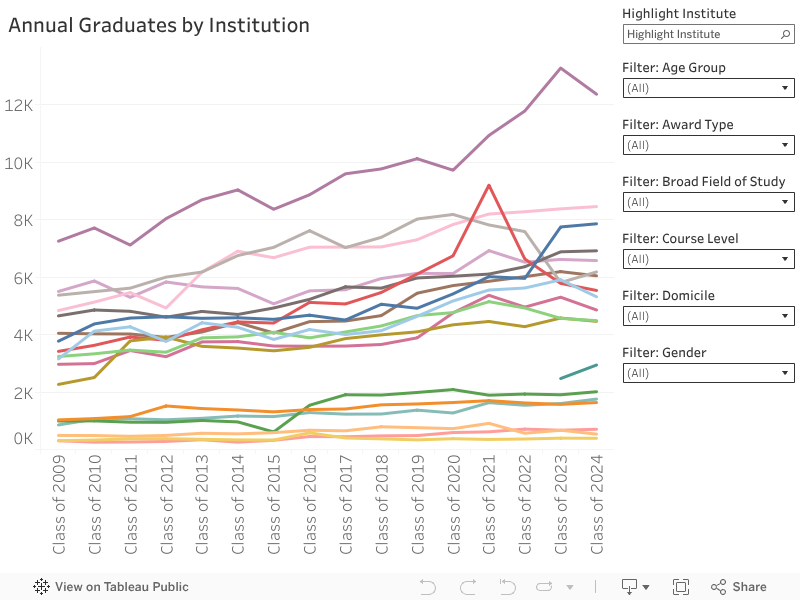
Total Graduates: UCD had the largest number of graduates in the Class of 2024. Their 12,365 graduates made up 13.9% of graduates across all institutions that year.
Changes in Numbers of Graduates: UCD graduated 6.9% fewer students in the Class of 2024, after seeing sharp increases the previous three years.
ATU had a similarly large graduating class in 2024 (7,855) as in 2023 (7,745), which was a significant increase from their previous years’ graduation numbers. ATU had the largest undergraduate graduating class, with 6,525 graduates.
TU Dublin graduated more students (+6.4%; 6,180 graduates) in the Class of 2024 after seeing three years of declining graduation numbers.
Following a spike in graduates in the Class of 2021, the number of graduates at SETU have been declining with 5,535 graduates in the Class of 2023, down 4.2% from the previous year.
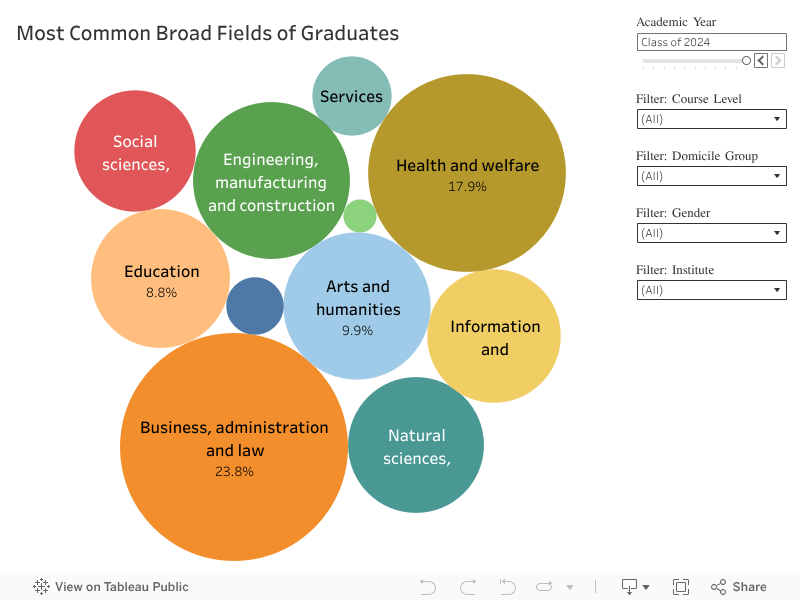
Total Graduates: Business, administration, and law produced the largest number (21,180) and share (23.8%) of graduates in the Class of 2024, as it has for more than a decade. The next largest broad field of graduates was Health and Welfare (17.9%). Engineering, Manufacturing, and Construction was the third largest field (11.3%), followed by Arts and Humanities (9.9%). The relative size of these last two is inverted relative to enrolments, where Arts and Humanities had more enrolments over the last several years than Engineering, Manufacturing, and Construction (see section A.4).
Course Level: Restricting focus to postgraduates, Information and Communication Technologies (ICT) rises to the third most populous graduate field (13.2%), followed in fourth by Education (10%).
Domicile Group: Amongst internationally domiciled graduates, ICT was the second largest graduating field (18.3%), behind Business, Administration, and Law (27.7%). Ireland-domiciled students followed the same pattern as the total graduates.
Gender: Amongst female graduates, the most common graduating field was Health and Welfare (24.3%), followed by Business, Administration, and Law (22.7%). In contrast, male students graduated most often from Business, Administration, and Law (23.8%) and Engineering, Manufacturing, and Construction (19.1%).
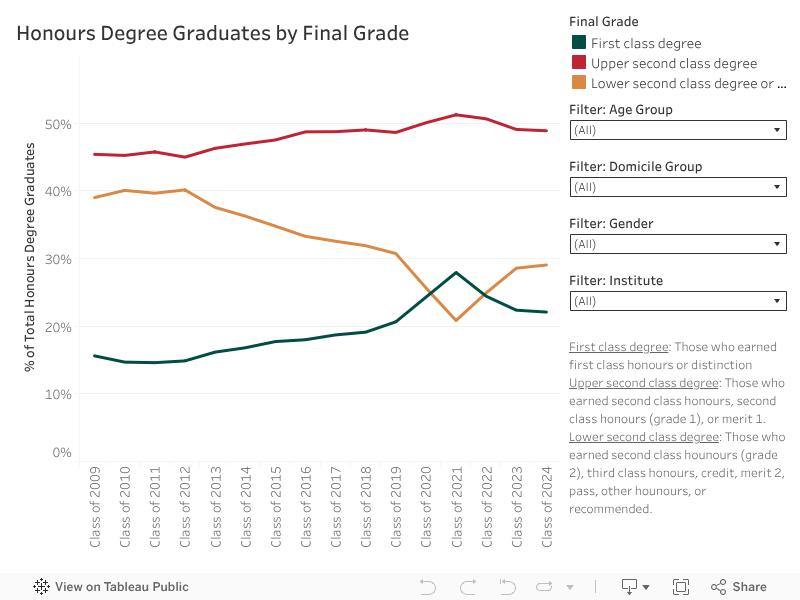
Class of 2024: Of the Undergraduate Honours Degree graduates in the Class of 2024, 22.1% (7,915) were awarded a first class degree, down from 22.4% for the Class of 2023 and 24.4% for the Class of 2022. Another 48.9% (17,520) were awarded an upper second class degree, down from 49.1% for the Class of 2023 and 50.6% for the Class of 2022. A final 29.0% (10,410) earned a lower second class degree or below, up from 28.6% in the Class of 2023 and 24.9% in the Class of 2022.
Trends: Since the Class of 2014, the percent of first class degrees and upper second class degrees has generally risen, while the percent of lower second class degrees or below has fallen. These inflationary trends were exacerbated during the period most impacted by COVID-19 (Classes of 2020, 2021, and 2022). In the most recent two classes, the data appears to continue the trends visible prior to COVID-19.
Age Group: Mature students earned a similar percent of first class degrees (22.4%) as those aged 23 or below (22.0%). They tended to earn fewer upper second class degrees (41.4% vs. 52.0%), however, corresponding with an increased number of lower second class degrees or below (36.2% vs 26.1%).
Gender: Females and males also earned a similar percent of first class degrees (22.9% and 21.0%, respectively). In contrast, females generally earned a higher percent of upper second class degrees (52.5% compared to 43.9%) and lower percent of lower second class degrees than males (24.6% vs 35.1%)
This dashboard, the previous format for presenting Key Facts and Figures, contains data from the last seven academic years. It can be most easily viewed in full-screen mode, by clicking on the double box icon in the lower right corner.