
Find information on how to make a Protected Disclosure under the external procedures in place in the HEA.
Find information on how to make a Protected Disclosure under the external procedures in place in the HEA.

INSPIRE is a €750 million investment package that will address research infrastructure needs across the higher education sector while ensuring alignment with national research and innovation priorities.

Tracking graduate outcomes is crucial to improving the quality of education for students and outcomes for graduates.
Cliceáil anseo chun an leagan Gaeilge a fháil / Click here to access in Irish
Student Grant Recipients: A Collaborative Data Analysis
4. Graduate Outcomes Statistics
As noted in the Introduction, the HEA has a Data Sharing Agreement (DSA) in place with Student Universal Support Ireland (SUSI), the national grant awarding authority. Through the DSA, SUSI has transferred data to the HEA which provides data from 2017/2018 to 2022/23 grant recipients. The data transferred includes students’ grant rates, adjacency rates and distance from college.
This analysis links the SUSI dataset and the HEA’s Graduate Outcomes Survey. The Graduate Outcomes Survey is Ireland’s national survey of higher education graduates, carried out approximately nine months after graduation. Data on economic status, salaries, sectors, occupations, location of employment/further study and graduate reflections are captured in this data set. Full details of the Graduate Outcomes Survey can be found at www.graduateoutcomes.ie.
The SUSI dataset was linked to the HEA’s Graduate Outcomes Survey Class of 2022 and considered the following variables:
Each section on this page consists of an interactive chart and the reader can choose to view the data by field of study, NFQ and gender by selecting the filter appropriately.
It is worth noting that the Graduate Outcomes Survey has undergone review in 2024 and this includes an assessment of data validity, among other aspects of the survey. This review will be published in Autumn 2024 on the HEA website. A key finding from this review is that the data is representative of the wider graduate population.
Purpose of this report and analytical approach
Readers are requested to take into account the analytical note included in the Introduction, noting that this report stands alone analytically within this suite of reports.
The purpose of this report is to compare graduate outcomes for SUSI grant recipients and non-recipients for the class of 2022. These are graduates who responded to the Graduate Outcomes Survey in 2023, approximately nine months after graduation.
The process linked 2017/18 – 2021/22 SUSI records with the Graduate Outcomes Survey Class of 2022 dataset, using PPSN and level of study (undergraduate or postgraduate) to identify matched records.
Given that the purpose of this report is to compare recipients and non-recipients, this report is restricted to Irish domiciled graduates. Also, given the low numbers of graduates at level 10 in receipt of a grant, the analysis is restricted to those graduates at NFQ Levels 6, 7, 8 and 9.
It should be noted that the dataset in this analysis does not encompass the full cohort of students in receipt of a SUSI grant. Other grant holders, such as those in further education, those in non-HEA-funded institutions and those studying abroad are not included in the analysis. This analysis is restricted to those studying higher education in HEA-funded institutions.
The Methodology and Definitions section of this suite of reports gives more details on the how the data was linked and the student/graduate cohort included.
Key Findings
A summary of the key findings is given as follows:
Grade Awarded
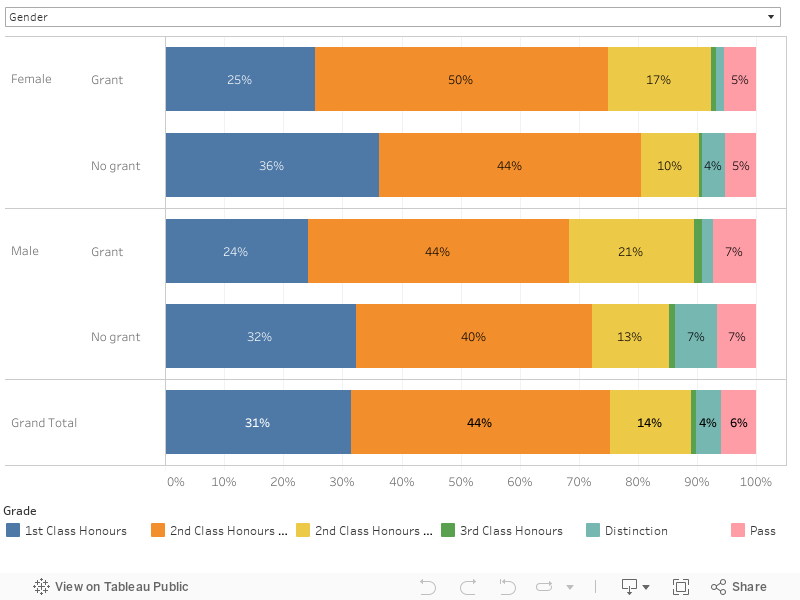
The chart above shows the grade awarded to grant recipients and non-recipients.
Field of Study
The largest differential between grant recipients and non-recipients in the award of first-class honours is in Information and Communications Technologies (ICTs), with 54% of non-recipients being awarded a first-class honours grade compared to 32% of grant recipients. Agriculture, Forestry, Fisheries and Veterinary shows the smallest differences in award of first class honours grades, 26% for grant recipients compared with 25% for non-recipients.
NFQ Level
There is an 8 percentage point difference in the award of first class honours at level 8: 33% of Level 8 non-recipients were awarded first-class honours; and this compares with 25% of Level 8 grant recipients. There is a 9 percentage point difference at level 9, with 41% of Level 9 non-recipients awarded a first-class honours and 32% of grant recipients awarded a first class honours.
Gender
There are differences between first-class awards when we consider the gender of graduates. For females there is an 11 percentage point difference between non-recipients (36%) and grant recipients (25%) receiving a first-class honours award. For males there is an 8 percentage point difference between non-recipients (32%) and grant recipients (24%) receiving an first-class honours award.
Main Graduate Destination
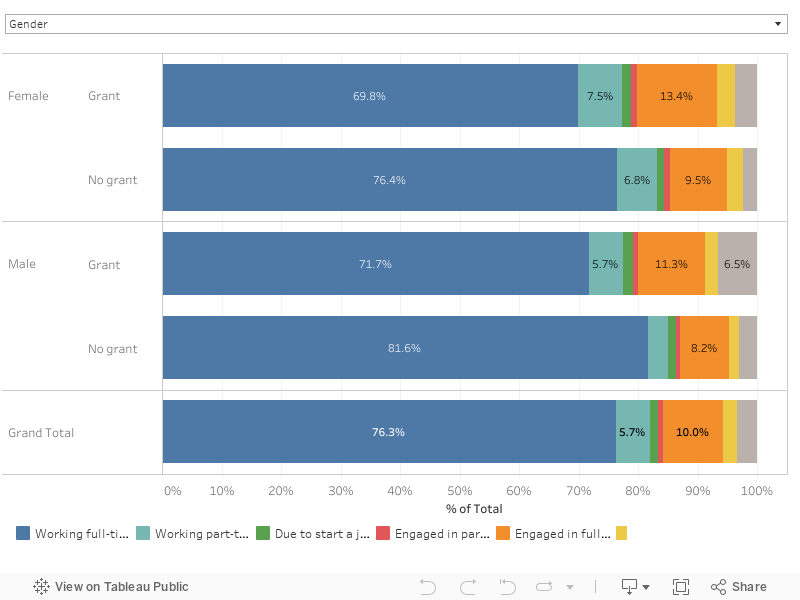
The chart above shows the main destination of graduates. These outcomes include:
Field of Study
Across nearly all fields of study non-recipient graduates are more likely to be in employment, except for the field of Natural Sciences, Mathematics & Statistics where employment outcomes are broadly similar.
NFQ Level
Across all NFQ levels, non-recipient graduates are more likely to be in employment. Grant recipients were slightly more likely to go into further study at most NFQ level, with the exception of level 8 where outcomes for the two cohorts are very similar. However, there are still over 70% of the overall grant receiving cohort found in employment.
Gender
86.4% of non-recipient male graduates were in employment nine months post-graduation, compared with 78.2% of graduates in receipt of a grant. The same figures for female graduates were 84.3% (non-recipients) and 78.7% (recipients).
Occupation Type
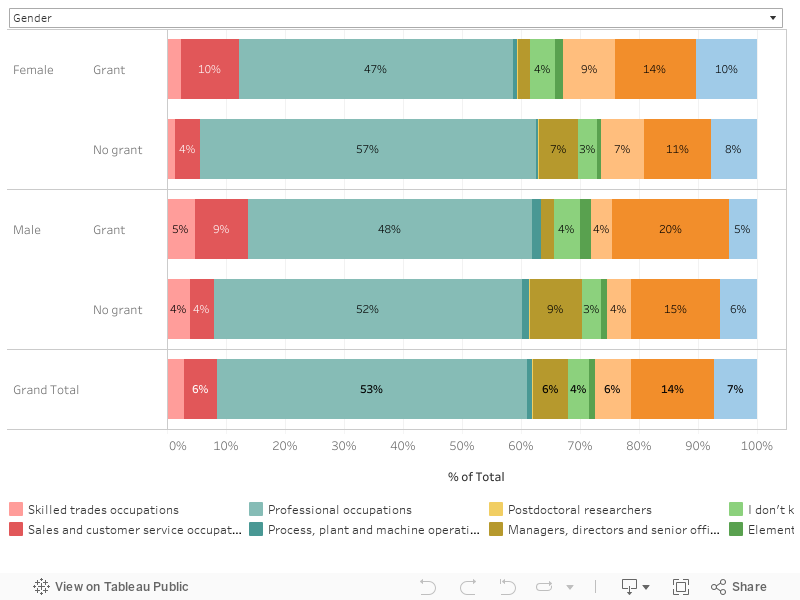
The chart above shows the occupation of graduates in employment, nine months after graduation. The most common occupation for graduates is Professional Occupations. Graduates’ occupations are linked with both field of study and NFQ level.
Field of Study
Across most fields of study, non-recipients were more likely to be employed in Professional Occupations than grant recipients. Graduates of Education are exceptional in this instance with 87% of both grant recipients and non-recipients in Professional Occupations.
NFQ Level
For Level 8 graduates, 52% of non-recipients were employed in Professional Occupations, compared with 46% of grant recipients. At level 9 graduates, 12% of non-recipients were employed as Managers, Directors and Senior Officials compared with 3% of grant recipients.
Gender
52% of non-recipient males who were in employment were employed in Professional Occupations compared with 48% of recipients. The corresponding figures for females were 57% for female non-recipients and 47% for female grant recipients.
Sector of Employment
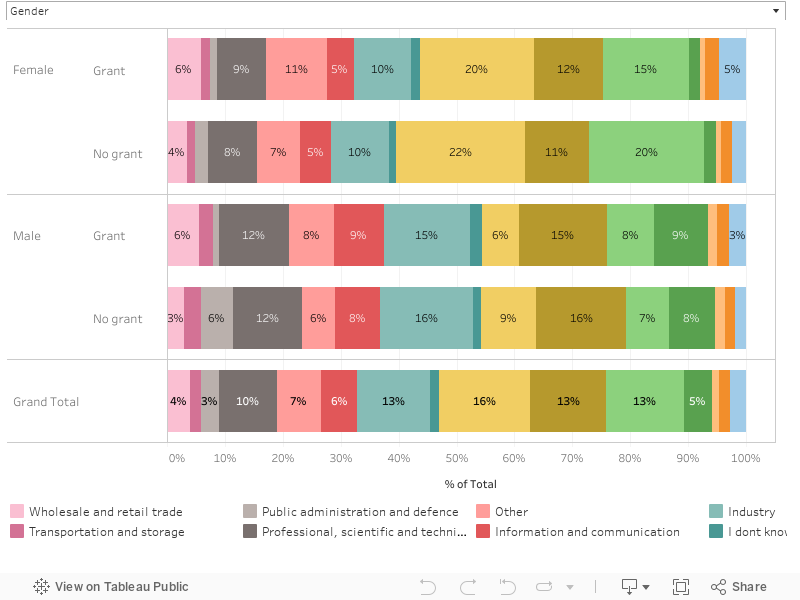
The chart above gives the sector of employment of employed graduates nine months after graduation. Graduates tend to work across a very wide range of sectors, and sector of employment is strongly linked with a graduate’s field of study. For example, graduates of Health and Welfare programmes are most likely to work in the Human Health and Social Work Activities sector; and graduates of Education programmes are most likely to work in the Education sector.
Field of Study
69% of non-recipients who studied Health & Welfare were employed in the Human Health and Social Work Activities sector. This compares to 62% of grant recipients.
NFQ Level
17% of Level 8 non-recipients were employed in Human Health and Social Work Activities, compared with 15% of grant recipients.
Gender
20% of female non-recipients were employed in the Education sector, compared with 15% of recipients.
Salaries
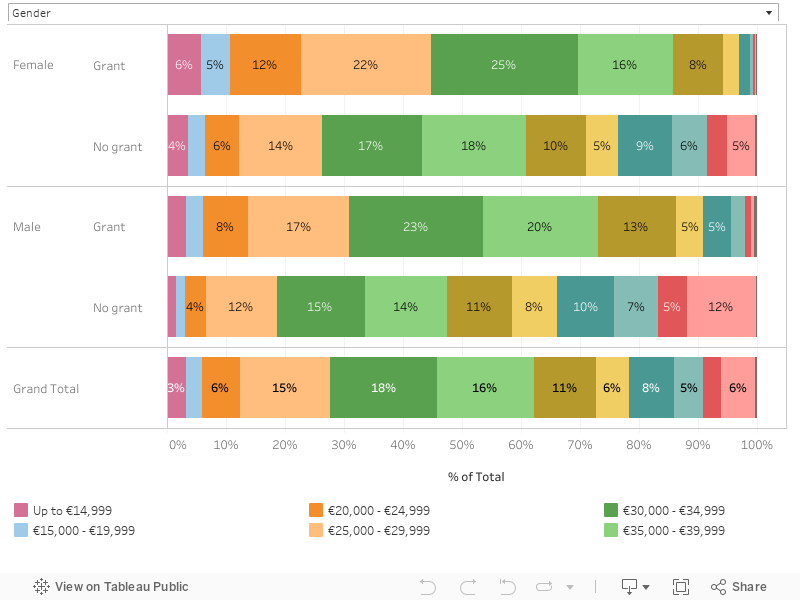
The chart above gives the salary bands of employed graduates nine months after graduation.
Field of Study
12% of ICT graduates who were non-recipients earn over €80,000, compared with 1% of ICT grant recipients. Non-recipients were more likely to earn in excess of €80,000 for every field of study than grant recipients.
NFQ Level
For Level 9 graduates, 15% of non-recipients earned over €80,000, compared with 1% of recipients.
Gender
12% of male non-recipients earned over €80,000, compared with 1% who received a grant. The corresponding figures for females are 5% for female non-recipients and less than 1% for recipients.
Location of Employment
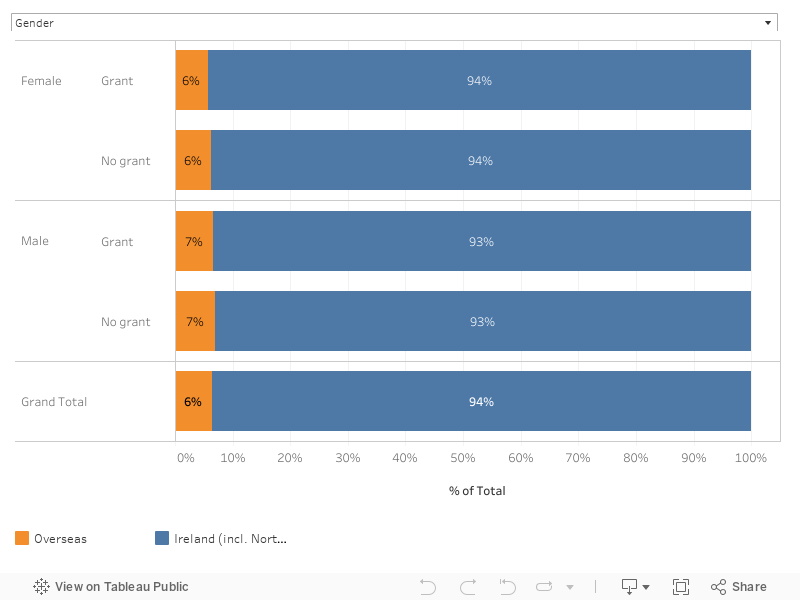
The chart above shows whether an employed graduate is working in Ireland or overseas. In this instance, we see little difference in outcomes for grant recipients and non-recipients.
Field of Study
9% of Social Sciences, Journalism & Information graduate non-recipients were employed overseas, compared to 7% of grant recipients.
NFQ Level
7% of Level 8 graduate non-recipients were employed overseas, compared to 6% of level 8 grant recipients.
Gender
There is little gender difference in terms of location of employment, with 6% of females and 7% of males working overseas from both grant cohorts.
Relevance
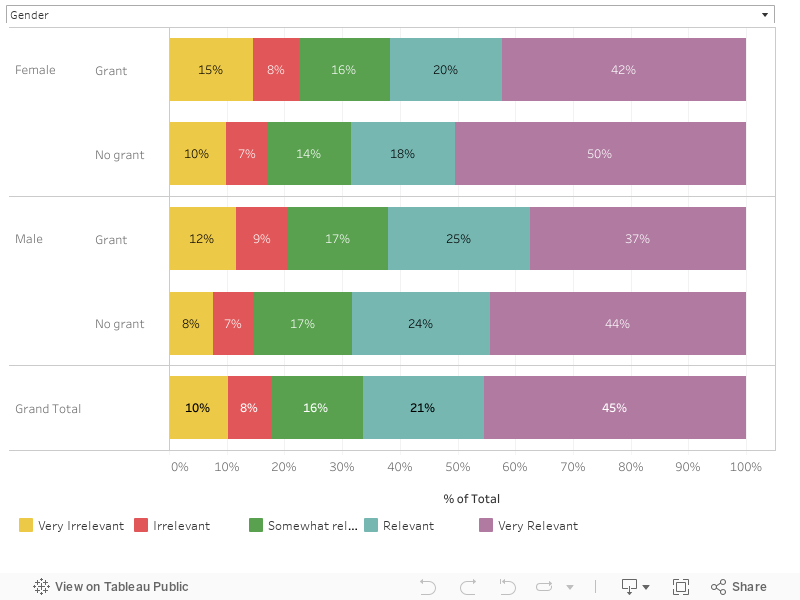
The chart above gives graduates’ assessment of how relevant their course is to the job.
Field of Study
Non-recipient graduates across nearly all fields of study were more likely to consider their course “relevant” or “very relevant” to their job than grant recipients.
NFQ Level
64% of non-recipient Level 8 graduates considered their course either “relevant” or “very relevant” to their job versus 61% of grant recipients.
Gender
68% of females non-recipients considered their course either “relevant” or “very relevant” to their job versus 62% of female grant recipients. The corresponding figures for male non-recipients were 68% versus 62% for male grant recipients.