
Find information on how to make a Protected Disclosure under the external procedures in place in the HEA.
Find information on how to make a Protected Disclosure under the external procedures in place in the HEA.

INSPIRE is a €750 million investment package that will address research infrastructure needs across the higher education sector while ensuring alignment with national research and innovation priorities.

Tracking graduate outcomes is crucial to improving the quality of education for students and outcomes for graduates.
Course Profile
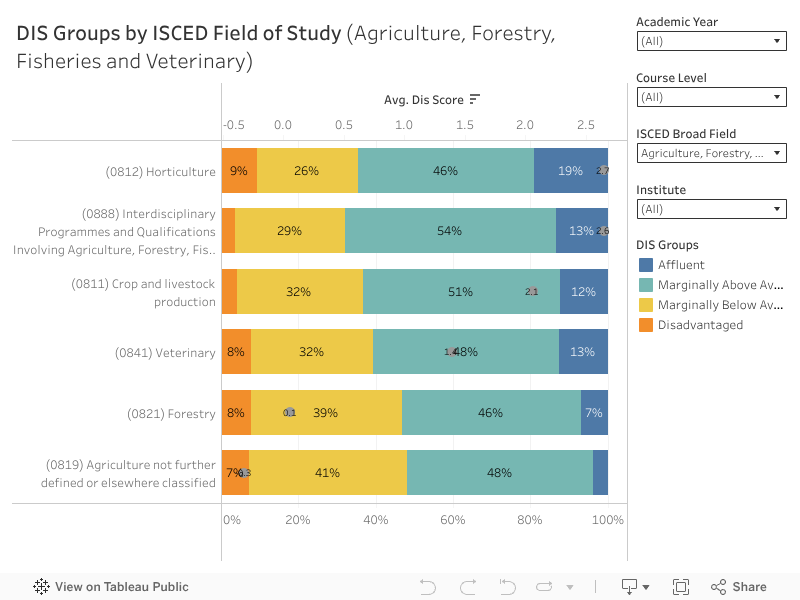
This chapter explores the socio-economic background of higher education students by the following characteristics:
Course Level
NFQ Level
Field of Study
Detailed Field of Study
Programme Type
Institute
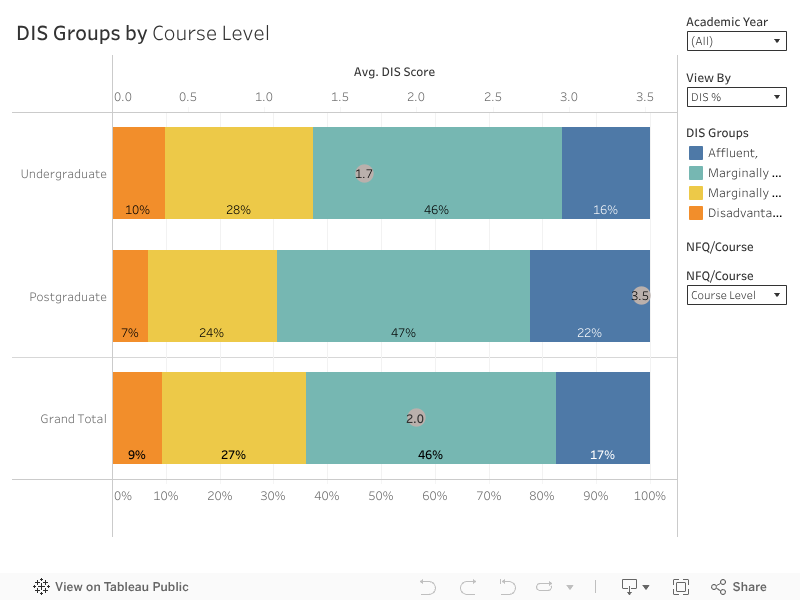
Course Level: Postgraduates (3.5) tended to be more Affluent than Undergraduate students (1.7). 22% of Postgraduate students were Affluent, compared to 16% of Undergraduate students.
24% of Affluent students were studying Postgraduate programmes, compared to only 14% of Disadvantaged students.
NFQ Level: By NFQ Level, those that studied NFQ Level 6 and 7 programmes tended to be most deprived, with a DIS of 0.1 and 0.2, respectively. Meanwhile, those that studied NFQ Level 10 programmes were most Affluent (4.1). Only 2% of NFQ Level 10 students came from Disadvantaged areas.
A much higher proportion of Disadvantaged students were studying NFQ Level 7 programmes (16%) compared to Affluent students (9%).
10% of Disadvantaged students were pursuing NFQ Level 9 programmes, compared to 19% of Affluent students.
Programme Type: Undergraduate students studying Foundation programmes (Access and Foundation) were most deprived (-2.3), with 22% of students coming from Disadvantaged areas. Students studying Occasional programmes were most Affluent (DIS = 3.1), were 23% are Affluent.
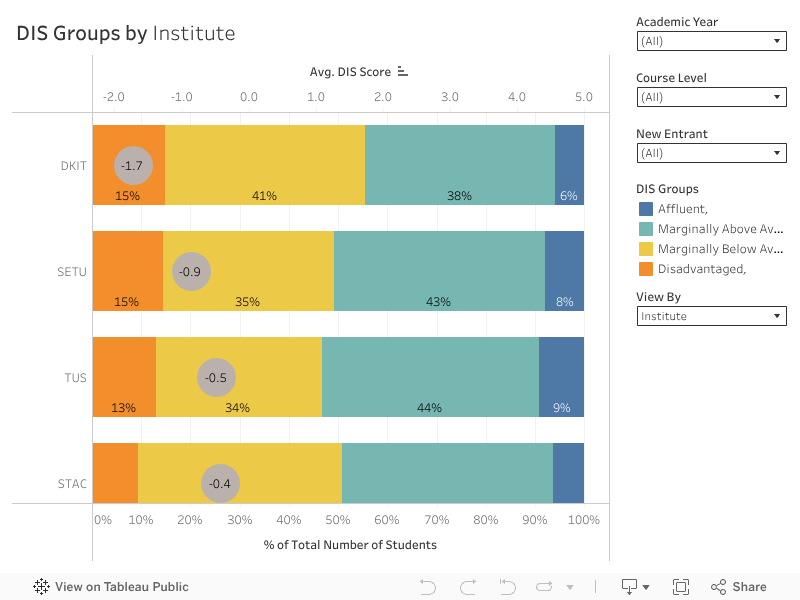
Institute: DKIT students were most deprived (-2.0), where 15% of students came from Disadvantaged areas. This was followed by SETU (-1.2). In contrast, TCD and UCD students were most Affluent (4.7) both with 29% of students being Affluent. This was followed by RCSI students (4.3).
Programme Type: Masters Research students were the most deprived Postgraduate student (1.8). 9% of students were from Disadvantaged areas. Meanwhile, students of Postgraduate Certificate and PhDs were most Affluent (4.1).
Institute: For Postgraduates, students from St. Angela’s College were relatively deprived (0.1). 42% were from Marginally Below Average areas. IADT students were most Affluent (5.4). 33% of students were Affluent, 44% were Marginally Above Average. Only 17% of IADT students were from Marginally Below Average areas.
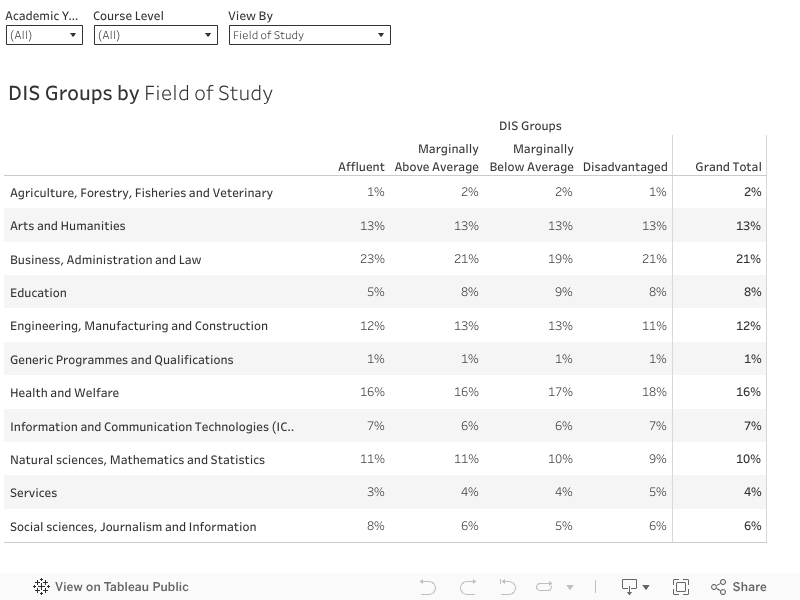
Field of Study: The most common field of study for all Undergraduate students was Business, Administration and Law (21%). This was followed by Health and Welfare (15%) and then by Arts and Humanities (14%). Health and Welfare was a slightly more popular option among Disadvantaged students (17%) compared to Affluent students (14%). Similarly, Services was a slightly more popular option for Disadvantaged students (6%) than Affluent students (3%).
Programme Type: 82% of Affluent students pursue an Undergraduate Honours Degree, compared to 71% of Disadvantaged students. An Undergraduate General Degree was more common for Disadvantaged students (13%) than Affluent students (5%).
Institute: By Institute, the three most common institutes for Disadvantaged students were ATU (14%), TU Dublin(13%), and SETU (11%). However, note that the overall size and intake of each of these Institutes influenced results here – compare to the total to observe differences. For example, ATU students represented 10% of the total Undergraduate population, but ATU students represented 14% of total Disadvantaged students.
Field of Study: Amongst Postgraduate students, Health and Welfare (23%), Business, Administration and Law (18%), and Education (15%) were the three most common choices. Business, Administration and Law was a slightly more popular choice amongst Affluent students (21%) than Disadvantaged students (16%). In contrast, Education was a slightly more popular choice amongst Disadvantaged students (19%) than Affluent students (11%).
Programme Type: Only 7% of Affluent students were studying Higher Diplomas, compared to 9% of Disadvantaged students. Nonetheless, overall, there were no major differences observed. However, it is worth reiterating, that overall a much lower proportion of Disadvantaged students were pursuing Postgraduate courses – 14% of Disadvantaged students, compared to 24% of Affluent students. This represents a 10-percentage point difference.
Institute: For Postgraduate students, UCD (15%) and UCC (11%) were the two most common choices for Disadvantaged students. However, note that overall, UCD students represented 19% of the Postgraduate student population. While SETU students made up 5% of the total Postgraduate student population, SETU students made up 7% of the total Disadvantaged student population.
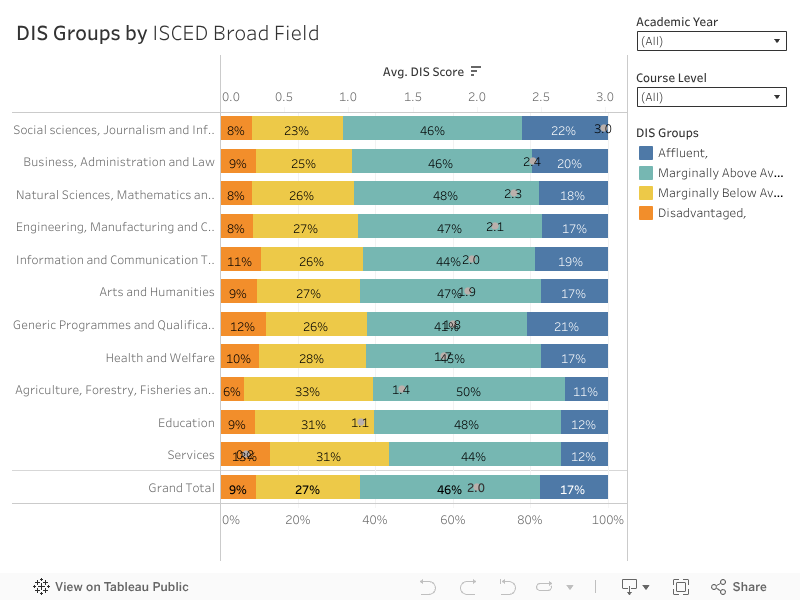
Field of Study: Undergraduate students studying Services were the most deprived (0.0). Note that the average DIS for all Undergraduates was 1.7. Social Sciences, Journalism and Information students were most Affluent (2.7). 21% of these students were Affluent.
At Undergraduate Level, Military and Defence students were most deprived (-2.4). Most students were Marginally Above Average (37%) or Marginally Below average (34%). This was followed by students studying Welfare Not Further Defined or Elsewhere Classified (-2.3). 22% of these students were Disadvantaged.
Undergraduate Economics students were the most Affluent (6.4). Only 4% of these students were Disadvantaged, while 36% were Affluent. Moreover, 47% were Marginally Above Average. This means that 83% of Undergraduate Economics students came from Marginally Above Average or Affluent areas.
This was followed by Interdisciplinary Programmes and Qualifications Involving Information and Communication Technologies (5.2), and Medicine (5.2).
Field of Study: Overall, for Postgraduates, the average DIS was 3.5. Education students were relatively deprived (2.0). However, note that 63% of these students were Marginally Above Average or Affluent. Postgraduate students studying Generic Programmes and Qualifications were most Affluent (4.5). This was followed by Business, Administration and Law students (4.3).
Similar to what was observed at Undergraduate level, Childcare and Youth Services was relatively deprived (-1.1). 50% of students were Disadvantaged or Marginally Below Average. This was followed by Teacher Training Without Subject Specialisation (1.2).
In contrast, Library, Information and Archival students were most Affluent (5.5), alongside Statistics students (5.5).
Key Points:
Of all students, Childcare and Youth Services students were the most deprived (-1.8), where 17% of students were Disadvantaged. This was followed by Military and Defence (-1.6). Meanwhile, Economics students were the most Affluent (6.1), where 81% of students were Marginally Above Average or Affluent.