
Find information on how to make a Protected Disclosure under the external procedures in place in the HEA.
Find information on how to make a Protected Disclosure under the external procedures in place in the HEA.

INSPIRE is a €750 million investment package that will address research infrastructure needs across the higher education sector while ensuring alignment with national research and innovation priorities.

Tracking graduate outcomes is crucial to improving the quality of education for students and outcomes for graduates.
Socio-Economic Profiles 2021/22 to 2023/24
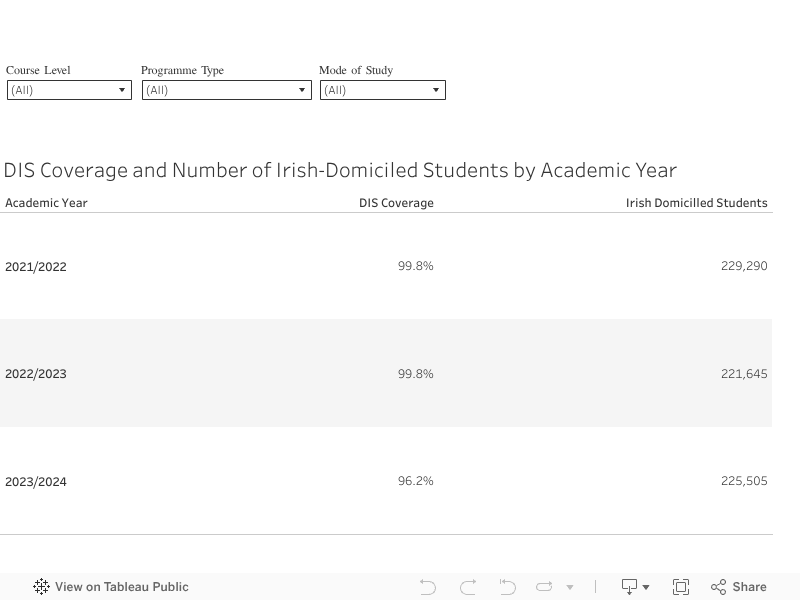
The HEA uses Deprivation Index Scores (DIS) to assess the socio-economic profiles of higher education students in Ireland. Widening participation for equity of access is of utmost importance — this is to ensure that the higher education student population reflects the diversity of the wider population in Ireland. Data led evidence in this area is crucial to policymakers to drive and implement change and to further promote accessibility of third-level education to all.
This latest set of socio-economic profiles relates to the academic cohort of students between 2021/22 and 2023/24. The number of Irish-domiciled students over this period was highest in 2021/22 at 229,290 and most recently in 2023/24 was 225,505. DIS coverage remains very high, with a 96.2% coverage in 2023/24 and 99.8% coverage in 2021/22 and 2022/23.
How affluent or deprived is the area you live in?
The Deprivation Index Score measures the relative affluence or deprivation of a particular geographical area. This report uses data from the 2022 Census, and is measured right down to street level, based on small-area statistics (on average, 80-100 households).
The Deprivation Index Score aims to show the extent to which every neighbourhood, suburb, and village is affluent or deprived. Ten key indicators are included in this measure (e.g., the proportion of skilled professionals, employment levels, education levels).
More information on Deprivation Index Scores can be found here.
The Socio-Economic Profiles requires an Irish students home address. Therefore, by default, only Irish-domiciled students were included in the analyses. In total, there were 225,505 Irish-domiciled students in 2023/24. Of these, only 3% of addresses could not be assigned a DIS. On average DIS coverage for the 2021/22-2023/24 profiles was 98%.
Note that all graphs and visualisations provided in this report have a minimum cell count of 100 students applied, unless otherwise stated and all numbers are rounded to the nearest 5 in line with statistical disclosures best practices.
There are some slight changes in methodology since the last publication in 2020/2021 available here.
Deprivation Index Scores (DIS) range from a scale of -40 (most disadvantaged) to +40 (most affluent). DIS scores are categorised in the following way:
| -40 to -10: Disadvantaged |
| -10 to 0: Marginally Below Average |
| 0 to +10: Marginally Above Average |
| +10 to +40: Affluent |
Key Points:
• Over the 2021/22 to 2023/24 period 9% of higher education students in Ireland were Disadvantaged. This was consistent across all the academic years in the period. 17% of students were Affluent, 27% were Marginally Below Average, and 46% were Marginally Above Average.
• The average DIS score for the period 2021/22-2023/24 was 2.0.
• Postgraduate students tended to be more Affluent (3.5) than Undergraduate students (1.7).
• 24% of Affluent students were engaged in Postgraduate studies, only 14% of Disadvantaged students were engaged in Postgraduate studies.
• By entry basis of Undergraduate New Entrants, students that entered through the HEAR scheme were most disadvantaged (-4.4). In contrast, students that entered through the DARE scheme were most Affluent (3.7).
• 78% of Affluent students entered higher education through Second Level School Leaving Exams over this period 2021/22 to 2023/24, compared to 61% of Disadvantaged students. For Disadvantaged students, 13% entered through HEAR, and 9% entered through a Further Education Award or Equivalent.
• By detailed field of study, Childcare and Youth Services were most disadvantaged (-1.8), while Economics students were the most Affluent (6.1).
• Students from Dublin were most Affluent (4.6), while students from Longford were most disadvantaged (-4.8).