
Find information on how to make a Protected Disclosure under the external procedures in place in the HEA.
Find information on how to make a Protected Disclosure under the external procedures in place in the HEA.

INSPIRE is a €750 million investment package that will address research infrastructure needs across the higher education sector while ensuring alignment with national research and innovation priorities.

Tracking graduate outcomes is crucial to improving the quality of education for students and outcomes for graduates.
7. Earnings Analysis
The following analysis looks solely at those who reported full-time employment, and where salary data was provided. Thus, the total number of graduates included in the analysis was 15,437.
Figures shown, including model results, are weighted to account for differing response rates by institute, NFQ level and mode of study. Furthermore, the following graphs are split into results for all graduates and results for younger graduates only (<30).
7.1 Overview of Graduate Earnings
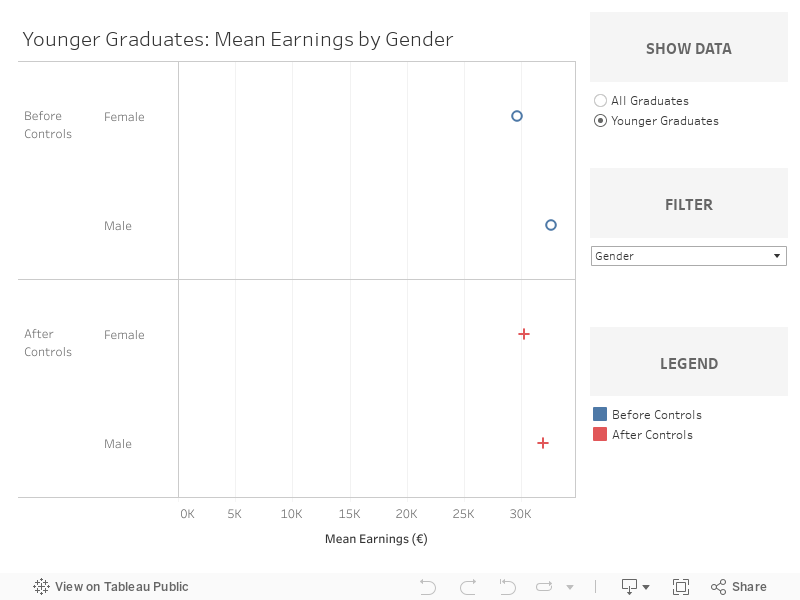
Nine months after graduation, the average salary for all graduates was €36,248 and €31,065 for younger graduates.
“Before Controls” represent the raw average salaries. “After Controls” relates to model predicted average salaries, after controls are used to attempt to explain the variation in earnings (these include institute type, gender, field of study, socio-economic background, region of employment, NFQ level, and Leaving Certificate points).
Looking at Younger Graduates (<30), After Controls:
Gender: Nine months after graduation, taking the above variables into consideration, males earned €31,950, while females earned €30,277. This represents a difference of €1,673. Other factors not mentioned above, such as hours worked, earnings expectations or negotiation skills are not accounted for.
Institute Type: Universities + Colleges saw average salaries of €31,417, while IOTs earned €30,412 – a difference of €1,005 even after taking the above variables into consideration.
Field of Study (ISCED): After controls, Education graduates had an average salary of €33,700, while Arts & Humanities graduates earned €27,226. This represents a difference of €6,474. Field of study is a key factor in explaining differences in earnings by other factors (such as gender or institute type).
Leaving Cert Points: Young graduates who attained 555 – 600 points in the Leaving Cert had the highest earnings 9 months after graduation, at €33,485. This is €2,569 more than graduates who attained 455 – 505 points.
NFQ Level: After controls, Level 10 graduates earn €37,843 – €5,629 more than Level 9 graduates and €7,346 more than Level 8 graduates.
Region of Employment: Graduates working in Dublin earned the most nine months after graduation (€31,726). This is €2,350 more than graduates in employment in the West.
7.2 Explained and Unexplained Differences in Earnings
Further to the above analyses, variations in earnings were further broken down into explained differences in earnings versus unexplained differences in earnings. Any unexplained differences in earnings should not simply be considered discrimination as there are other factors not included in the models (such as hours worked, earning expectations, negotiation and bargaining skills).
Explained and Unexplained Differences by Gender
Total difference in raw mean salaries: €2,978 (100%)
Unexplained difference (difference after controls): €1,673 (56%)
Thus, explained difference: €1,305 (44%)
From the above, 44% of gender earning differences can be explained. For example, more males completing Engineering and ICT, which are high-earning fields.
Nonetheless, this results in 56% unexplained. Unexplained differences could include higher rates of return for males working in other countries and higher rates of return for males that achieved a 1st vs a 2.1 compared to females.
Explained and Unexplained Differences by Institute Type
Total difference in raw mean salaries: €2,119 (100%)
Unexplained difference (difference after controls): €1,005 (47%)
Thus, explained difference: €1,113 (53%)
From the above, 53% of differences in earnings can be explained. For example, there are more University and College Education graduates, which is a high-earning field. Moreover, a greater number of NFQ Level 10 graduates come from Universities, who also tend to earn more.
For the unexplained differences, better rates of return for University graduates in the Financial & ICT NACE sectors could contribute to the unexplained difference.
Explained and Unexplained Differences by Socio-Economic Background
Total difference in raw mean salaries: €1,953 (100%)
Unexplained difference (difference after controls): €632 (32%)
Thus, explained difference: €1,953 (68%)
More than two-thirds (68%) of the differences in earnings by socio-economic background can be explained. For example, fewer disadvantaged graduates come from Universities, fewer disadvantaged graduates work in Professional Occupations, and fewer disadvantaged graduates achieve over 550 points in the Leaving Cert.
For the unexplained differences, better rates of return with age for non-disadvantaged graduates, and better rates of return for non-disadvantaged graduates from Business, Administration & Law could contribute to the unexplained differences.
7.3 Regional Mobility
The below chart demonstrates the regional mobility of graduates, such as transitions from home region to employment/institute region, and institute region to employment region. Younger graduates (<30) can also be selected.
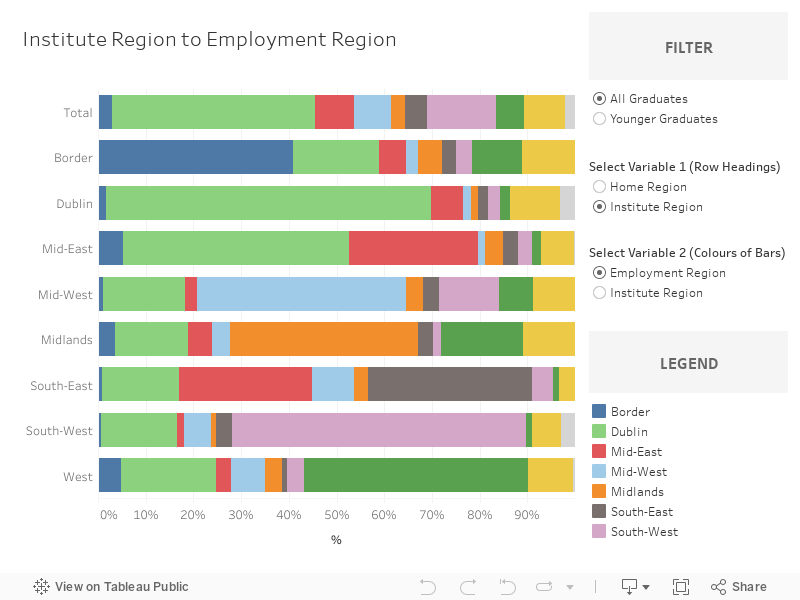
All Graduates, Institute to Employment
More than two-thirds (68%) of graduates who study in Dublin stay in Dublin for employment. Similarly, graduates who study in the South-West are likely to stay in the South-West for employment (62%). On mobility, 47% of graduates who study in the Mid-East move to Dublin for employment.
All Graduates, Home to Employment
Looking at home region and employment regions, 84% of graduates who live in Dublin stay in Dublin for employment. Similarly, those who live in South-West tend to stay in the South-West for employment (68%). More than half (53%) of graduates who live in the Mid-East move to Dublin for employment.
All Graduates, Home to Institute
Most graduates (83%) who live in Dublin stay in Dublin for their studies. In the Mid-West, 52% who live in the Mid-West stay in the Mid-West for their studies. In the South-West, 76% who live in the South-West stay in the South-West for their studies.
For students from other countries, 64% opt to study in Dublin.
Go to next chapter: Barriers to Employment and Further Study