Find information on how to make a Protected Disclosure under the external procedures in place in the HEA.
Find information on how to make a Protected Disclosure under the external procedures in place in the HEA.

INSPIRE is a €750 million investment package that will address research infrastructure needs across the higher education sector while ensuring alignment with national research and innovation priorities.

Tracking graduate outcomes is crucial to improving the quality of education for students and outcomes for graduates.
Student and Course Match in Higher Education
Published: 23rd August 2021
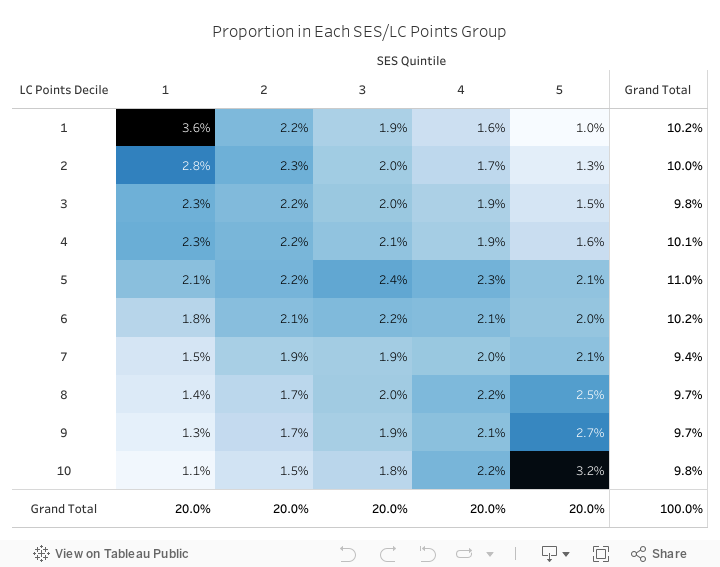
An analysis of student/course match in higher education in Ireland, covering 85,000 entrants in the years 2015, 2016, 2017 and 2018, shows that lower SES students that achieved high points in the Leaving Certificate undermatch (choose less selective HEIs/Courses) significantly more than higher SES students entering with high Leaving Certificate points. *SES = Socio-Economic Status and is based on Census small area deprivation index scores in this analysis, grouped into quintiles – quintile 1 are the most disadvantaged and quintile 5 are the most affluent. Leaving Certificate points groups are shown as deciles in this analysis, decile 1 are the lowest points entrants (mean 261 points) and decile 10 are the highest points entrants (mean 568 points). For context, Figure 1 below shows the profile of students by SES quintile and LC points decile, with lower numbers of low SES students in the higher points groups and higher numbers in the lower points groups, vice versa for high SES students.
Figure 1: Composition of Students by SES / LC Points Group
Findings are largely in line with previous HEA analysis, covering a different cohort, with 2017/2019 research in the UK conducted by UCL researchers (e.g. Wyness 2017) and with previous research in the Irish context (Delaney and Devereux 2020) showing that lower SES students are more likely than higher SES students to undermatch (choose courses filled with students that achieved lower points on average than they achieved) and less likely to overmatch (choose courses filled with students that achieved higher points on average than they achieved).
Figure 2 below shows mean Leaving Certificate points at entry (bars) by LC points decile and SES quintile, compared to minimum entry points required (light blue lines) and mean points of course peers for each group (dark blue lines). *Minimum entry points are the CAO end-of-season points – AQA (all qualified applicants) and audition/portfolio type entrant courses are not included.
Common to both low SES students (quintile 1) and high SES students (quintile 5) is overmatching at lower levels of the LC points distribution (LC points deciles 1, 2 and 3) and undermatching at higher points levels (e.g. LC points deciles 9 and 10). Lower SES students in particular exhibit high levels of undermatching at the highest points levels, i.e. disadvantaged students entering with high LC points tend to not choose the highest points courses as frequently as less disadvantaged students, even though they have the points to do so. Consequently, they tend to have higher points than their average classmates.
Figure 2: Points Analysis by Points Decile and SES Quintile
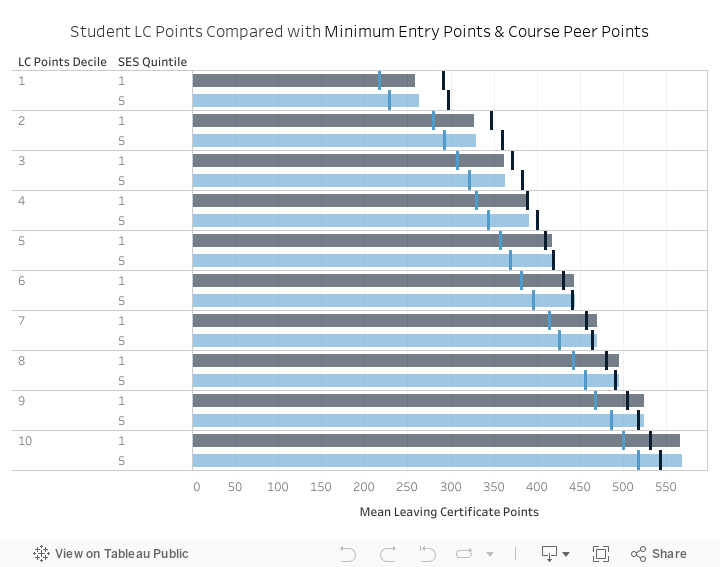
Figure 3 clearly shows the high levels of overmatching in the lower LC points deciles and undermatching in the upper LC points deciles. This is to be expected to some extent in the first and tenth deciles since these are the lowest and highest points entrants respectively and therefore naturally will have lower/higher points than classmates. Nonetheless, the differences by SES quintile are evident – low SES students have particularly high levels of undermatching in the upper LC points decile groups. For instance, low SES students in the highest LC points group have, on average, 35 points more than their course peers. This figure is 26 points for high SES students. This relationship maintains right throughout the upper LC points decile groups, with the difference between low SES students points and their course peers greater than high SES students points and their course peers, i.e. high SES students are more likely to choose courses with minimum entry points closer to the points they achieve (results are similar when entry points rather than mean course peer points are analysed). As detailed further below, high SES students tend to choose more selective institutes/courses, on average, than low SES students, at the same achieved points levels.
Figure 3: Difference Between Student and Course Peer Points
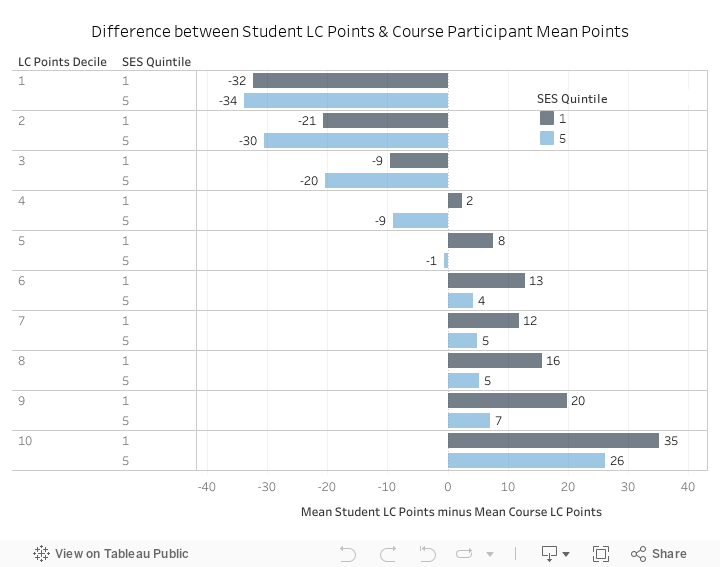
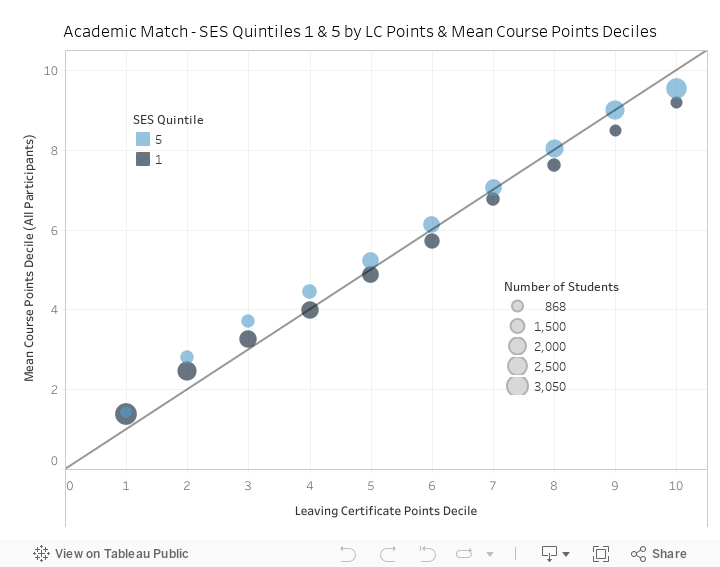
Figure 4 below plots the low and high SES students by LC points decile and mean course points decile (a measure of where on the course points spectrum each group lies). As per the results described above, overmatching is evident at the lower LC points level and undermatching is evident at the upper levels. However, once again, the differences by SES are clear – across all upper LC points levels, low SES students are undermatching more than high SES students, on average (further away from the line of parity, which indicates equal student/course match).
Figure 4: Academic Match – Student / Course Match by Deciles
The distribution of excess points over minimum required course points by SES in Figure 5 below confirms the tendency of low SES students to choose less selective institutes/courses on average than is possible given the points they achieved. 53% of high SES students have less than 40 excess points over the course minimum of their chosen course, compared to 44% of low SES students. Figure 6 provides the summary data covering key metrics used in the match analysis, by LC points decile and SES quintile.
Figure 5: Distribution of Excess Points Over Course Minimum
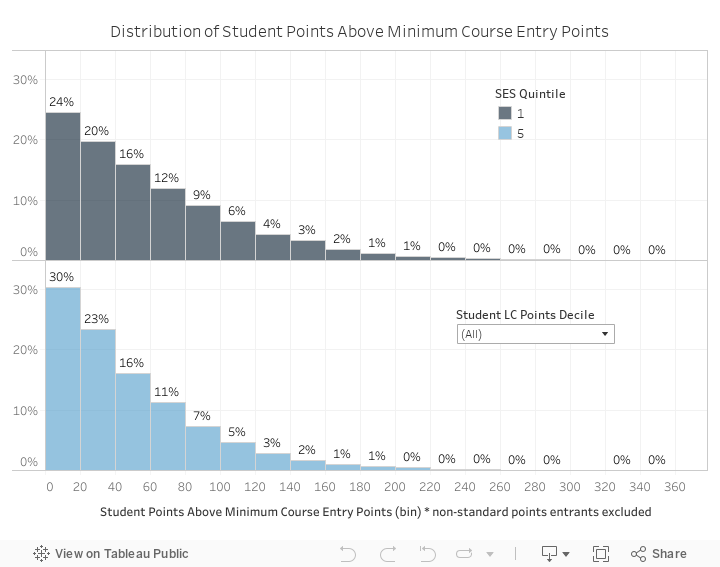
Figure 6: Full Academic Match Data Table by SES / Points
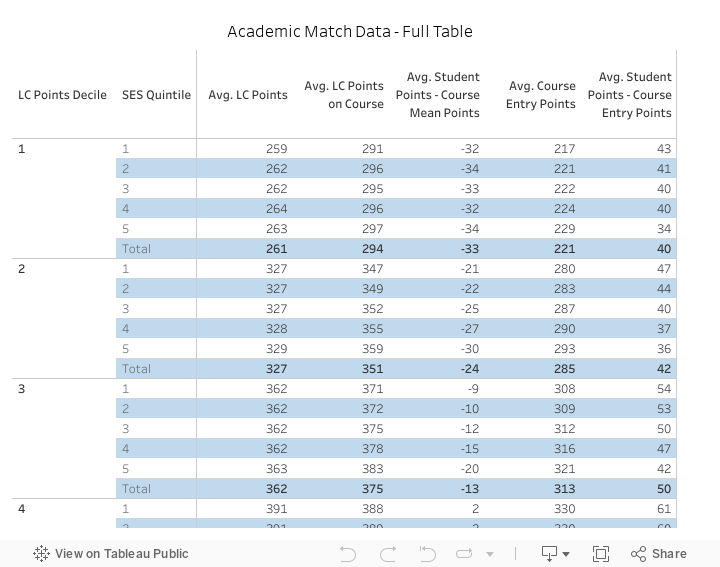
* Note: As per the table above, the overall mean excess Leaving Certificate points above minimum course entry points is 50. The overall median is 40, due to the long right tail as per Figure 5. The median varies from 34 points for SES quintile 5 to 43 for SES quintile 1.
As shown in Figure 7, based on the specific cohorts analysed here, UCD is the most popular HEI choice for high SES students (quintile 5) and UL is the most popular HEI choice for low SES students (quintile 1). This is obviously partly driven by geography (UCD is located in the most affluent local authority area in the Country and Limerick City has many of the most deprived areas in the Country) and also HEI size (UCD in particular). However, filtering by LC points decile and home County reveals some interesting patterns. Looking at LC points deciles 8-10 (the highest achieving students) for students from Dublin only, around 80% of high SES students with these characteristics attend UCD or TCD, compared with 64% of low SES students with the same characteristics. This is also partly, although not entirely, driven by geography, as DCU and TU Dublin City Campus are relatively more popular with high achieving low SES students, who are more frequently from north Dublin than south Dublin (high SES student numbers are vastly greater in south Dublin).
Figure 7: Institute Choice by Key Match Characteristics
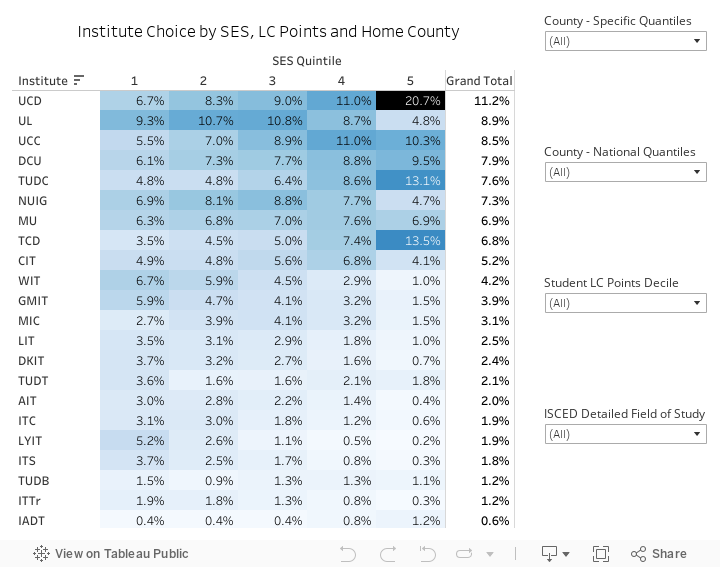
* Note: Overall HEI proportions above differ from actual total HEI proportions for these years due to missing Leaving Certificate and CAO data.
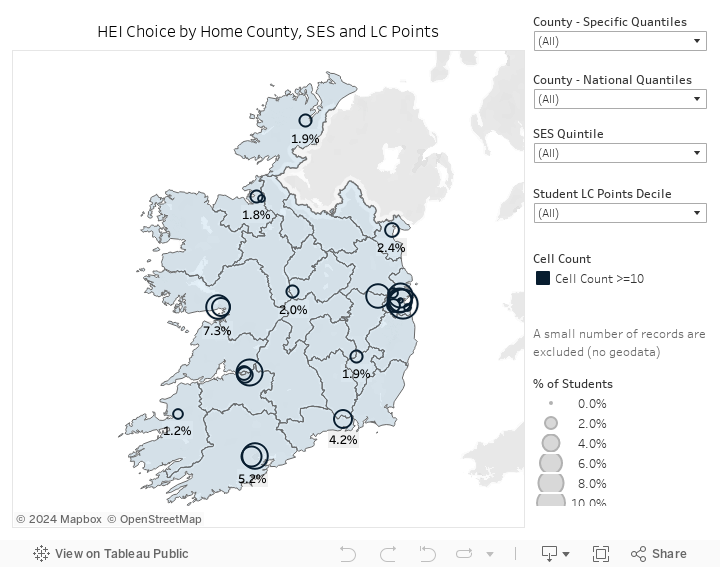
Looking at the combination of data in Figure 7 and the map in Figure 8, when filtered, shows that although high achieving students across the Country are more likely to travel longer distances to attend courses more closely matching their points level, low SES students are more likely than high SES students to attend an institute in their own region, leading to larger undermatches for low SES students. These patterns do vary substantially across the Country and by SES/LC points characteristics. For example, of the highest achieving students from Waterford (LC points deciles 8-10), 5.7% choose to attend WIT, but this proportion varies from 3.9% for high SES students to 7.1% for low SES students. In general however, high points students across the Country tend to most commonly travel to the university in their region for college, lower points students are more likely to attend their local institute of technology. In areas with both options, high points students are far more likely to attend the local university than the local institute of technology and vice versa for low points students, but this relationship does differ by SES. For high achieving students from Cork (LC points deciles 8-10), 74% of the high SES students choose UCC compared to 57% of the low SES students. Mary Immaculate College, UL and CIT are more popular choices for the high achieving low SES students from Cork than for the high SES students.
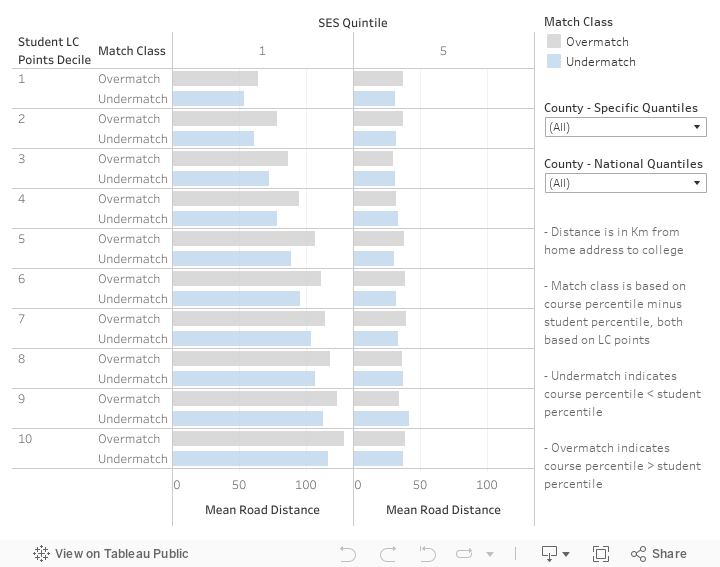
The chart at Appendix 2 shows that low SES students who undermatch travel less distance to college on average, i.e. travelling further improves course match on average. The significant difference in mean distance travelled to college between, rather than within, SES quintiles is reflective of the concentration of high SES students in urban areas nearer to HEIs.
Figure 8: Map of HEI Choice by Key Match Characteristics
Potentially of even greater interest than HEI choice, in terms of graduate outcomes and social mobility, is field of study choice, which varies greatly across and within institutes by SES, even at the same LC points levels. Figure 9 below shows the most popular field of study choices by SES quintile and LC points decile. Of the very highest achieving students (LC points decile 10), 4.7% choose to study medicine, one of the highest earning areas post-graduation. However, this proportion is only 3% for low SES students compared with 6.7% for high SES students. For the highest achieving students from Dublin only (LC points decile 10), 8.2% of high SES students choose medicine compared to 3.8% of low SES students. Teacher training is a more popular field of study choice for high achieving low SES students than for high achieving high SES students.
Course choice within individual HEIs varies substantially by SES. The most popular field of study choice in TCD for high SES students (quintile 5) is social and behavioural sciences, comprised almost entirely of Business, Economic and Social Studies students (BESS). The most popular field of study choice in TCD for low SES students (quintile 1) is nursing and midwifery. Common across the system is the popularity of business courses with high SES students – in UCD, the business field is, by quite some way, the most popular field with high SES students (mainly Commerce). Nursing and midwifery is the second most popular field with low SES students in UCD, slightly less popular than business (although business is far less popular with low SES students). For the highest achieving students in UCD (LC points decile 10), medicine is the second most popular field for high SES students, after business, chosen by 11.6% of such students. However, medicine is only chosen by 6.2% of the highest achieving low SES students in UCD. Veterinary Medicine is very popular with the highest achieving low SES students in UCD (12.8%), second only to business. Veterinary Medicine is not particularly popular with the highest achieving high SES students (3.5%). Geography plays a key role in the Veterinary Medicine student body composition. It should be noted that capacity on business courses is generally much larger than on many other courses, partly responsible for the numbers taking courses in this area, but notable differences by SES are evident. Arts courses in universities usually also have large capacities but are less popular with high SES students. For example, over 30% of low SES students in NUI Galway choose Arts, this figure is only 21% for high SES students. Conversely, 21% of high SES students in NUI Galway choose business courses, compared to 12.7% of low SES students.
Figure 9: Field of Study Choice by Key Match Characteristics
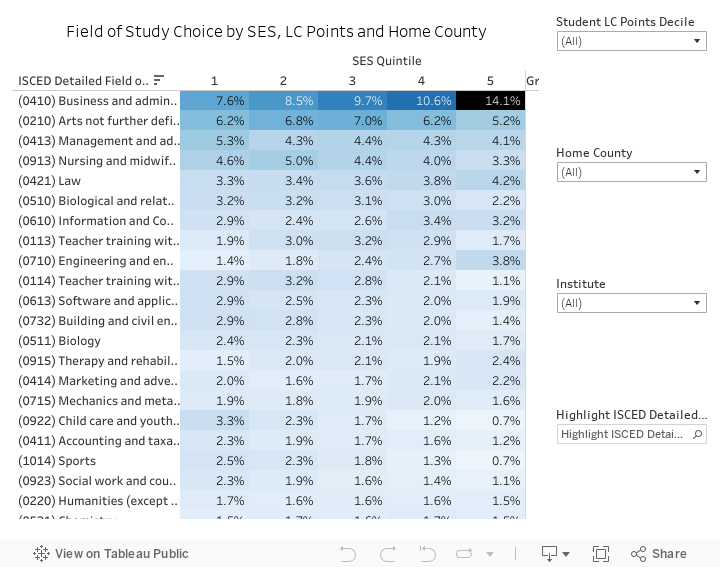
* Note: There are high proportions of missing Leaving Certificate and CAO data which impacts analysis at the field of study level of granularity, particularly within HEIs.
HEA completion analysis shows that students from disadvantaged backgrounds tend to perform as well, and better in some circumstances, than course peers from more advantaged backgrounds, once Leaving Certificate points at entry are controlled for. Therefore, ensuring full information is available to students when making course choice decisions is a key element of driving equity in higher education. Understanding student/course match is important as the findings here showing high levels of undermatching for low SES students with high Leaving Certificate points may be a factor influencing less favourable labour market outcomes, in terms of earnings, for disadvantaged students. Future analysis of student performance in higher education (progression and completion) and graduate outcomes analysis by socio-economic background will benefit from inclusion of similar match analysis. Matching analysis will also be strengthened once complete second level school data are available to the HEA to determine the full effects of second level school/peer culture on student course choice.
References:
Wyness, G. (2017). Rules of the game: Disadvantaged students and the university admissions process. London: Sutton Trust.
Campbell, S., L. Macmillan, R. Murphy, G. Wyness (2019). Inequalities in student to course match: Evidence from linked administrative data. Discussion Paper, Centre for Economic Performance, LSE.
Delaney J.M. and P.J. Devereux (2020). Choosing Differently? College Application Behaviour and the Persistence of Educational Advantage. Economics of Education Review, 77, 101998.
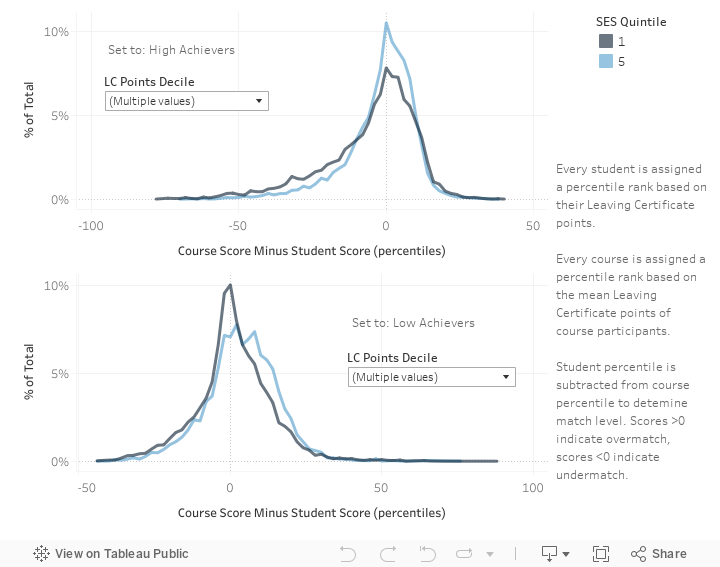
Appendix 1: Distribution of Match Scores by Achievement Level & SES
Appendix 2: Mean Road Distance to College by Match Class & SES