
Find information on how to make a Protected Disclosure under the external procedures in place in the HEA.
Find information on how to make a Protected Disclosure under the external procedures in place in the HEA.

INSPIRE is a €750 million investment package that will address research infrastructure needs across the higher education sector while ensuring alignment with national research and innovation priorities.

Tracking graduate outcomes is crucial to improving the quality of education for students and outcomes for graduates.
Student Profile
This chapter explores the socio-economic profile of higher education students by the following characteristics:
Gender
Age
New Entrant
Mode of Study
Entry Basis
Ethnicity/Disability (from Access Survey)
The Deprivation Index Score measures the relative affluence or deprivation of a particular geographical area. This report uses data from the 2022 Census, and is measured right down to street level, based on small-area statistics (on average, 80-100 households).
The Deprivation Index Score aims to show the extent to which every neighbourhood, suburb, and village is affluent or deprived. Ten key indicators are included in this measure (e.g., the proportion of skilled professionals, employment levels, education levels).
More information on Deprivation Index Scores can be found here.
Key Finding:
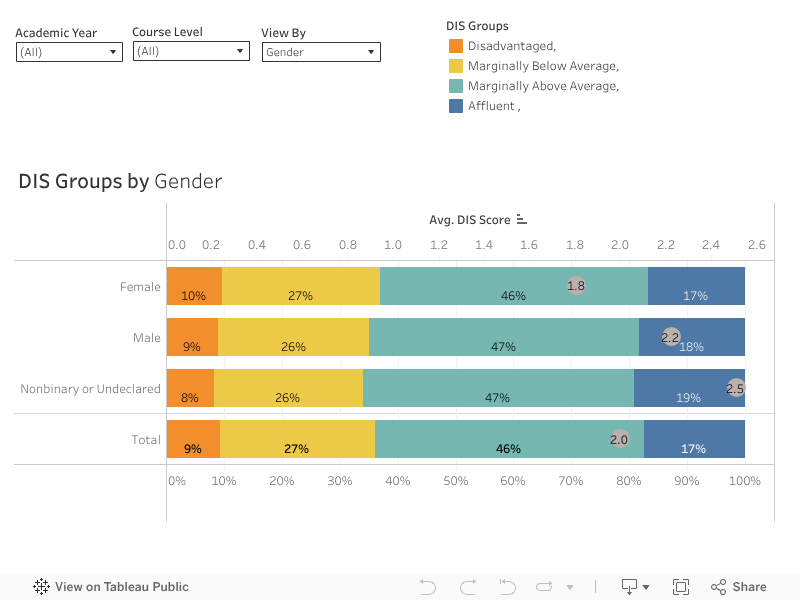
The average DIS for the Irish higher education population was 2.0. 9% were Disadvantaged, while 17% were Affluent. 73% of students sat somewhere in between – 27% were Marginally Below Average, and 46% were Marginally Above Average.
Overall: For Undergraduate students, the average DIS was 1.7. This was relatively deprived compared to the total average of 2.0 (Undergraduates and Postgraduates combined). 10% were Disadvantaged, 27% were Marginally Below Average, 46% were Marginally Above Average, and 16% were Affluent.
Gender: Students who identify as Non-Binary or Undeclared were relatively affluent (2.1). 17% of these students were Affluent. Students who identify as Female were relatively deprived (1.4) compared to Males (1.9).
Age: Mature students (aged 24 and over) on Undergraduate courses were more deprived (0.8) than students Aged 23 and Under (1.9).
New Entrant: Deprivation Index Scores did not differ hugely for new entrants (1.7) and all other Undergraduates (1.6).
Mode of Study: Full-time students had a DIS of 1.8, Part-time students had a DIS of 1.0. The newly included Other Mode of Study had an average DIS score of 1.2.
Overall: Postgraduate students tended to be more affluent (3.5) than Undergraduates (1.7). 22% of Postgraduate students in Ireland were Affluent, 47% were Marginally Above Average. 24% were Marginally Below Average, and 7% were Disadvantaged.
Gender: Similar to Undergraduates, Males tended to be more affluent (DIS 3.7) than Females (3.3).
Age: Mature students were more affluent (3.6) than students Aged 23 and Under (2.6). This contrasts with what was observed amongst Undergraduate students.
Mode of Study: For Undergraduates, there were no differences in DIS for Full-time and Part-time students. However, for Postgraduate students, those studying Part-time tended to be more affluent (3.9) than Full-time students (3.1). The newly added Other Mode of Study had an average DIS score of 3.2 at Postgraduate level.
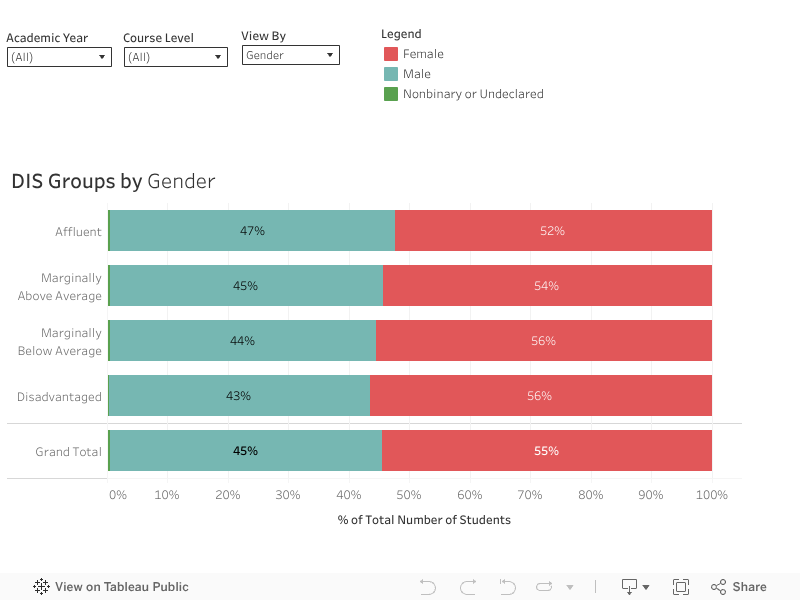
Gender: Female students made up a higher proportion of deprived cohorts – 56% of Disadvantaged students were Female, compared to 51% of Affluent students.
Age: While 28% of Disadvantaged Undergraduates were Mature students (aged 24 and over), only 21% of Affluent Undergraduates were Mature students.
New Entrant: There was a slightly lower proportion of Disadvantaged students that were new entrants (23%) compared to Affluent students (24%).
Gender: Similar to Undergraduates, there was a slightly higher proportion of Females in deprived cohorts than Affluent cohorts – 60% of Disadvantaged students were Female, while 57% of Affluent students were Female.
Age: Overall, the majority of Postgraduate students were aged over 24 (86%). However, there was a higher proportion of students aged 24 and over amongst those who were Affluent (89%) compared to Disadvantaged (84%).
Mode of Study: There was a higher proportion of Affluent students who were studying Part-time (47%) than Disadvantaged students (40%).
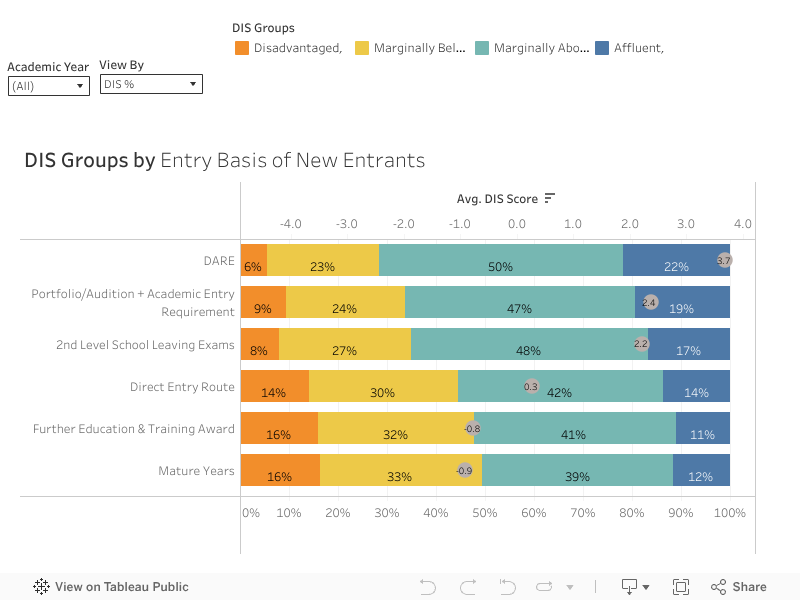
Approximately 61% of Disadvantaged students entered their Undergraduate programme through Second Level School Leaving Exams. Entering through Second Level School Leaving Exams was much more common for Affluent students – 78% of Affluent students entered their Undergraduate course via Second Level School Leaving Exams.
Focusing solely on the Entry Basis of Undergraduate New Entrants, students that entered through the HEAR (Higher Education Access Route) scheme were the most disadvantaged (-4.4). 28% of these students were Disadvantaged, while 34% were Marginally Below Average. Note that the HEAR scheme aims to support students from socially disadvantaged backgrounds. For more information on the HEAR scheme, see here.
Students entering through DARE (Disability Access Route to Education) were most affluent (3.7). 22% of these students were Affluent, and 50% were Marginally Above Average. For more information on the DARE scheme, see here.
9% of Disadvantaged students entered higher education through a Further Education & Training Award, compared to only 4% of Affluent students.
Entering through Mature Years and HEAR was also more common amongst Disadvantaged students (combined 19%) than Affluent students (combined 4%).

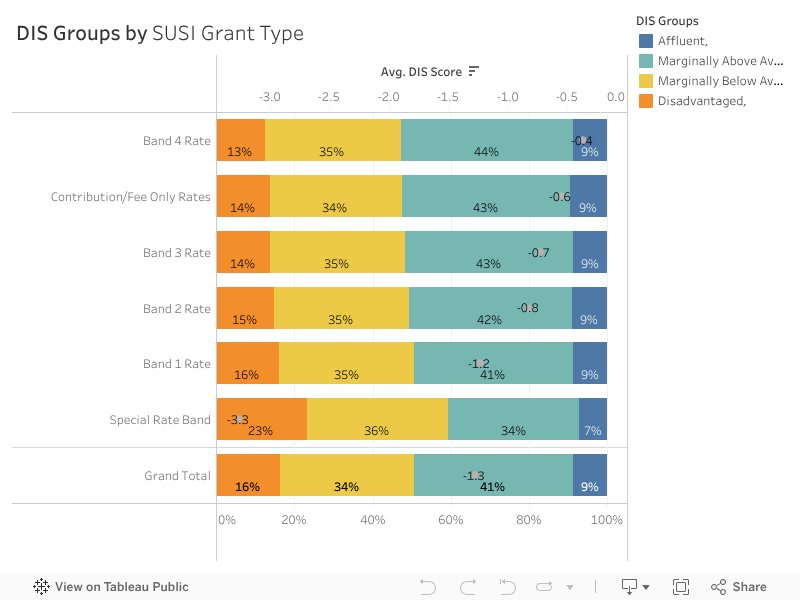
Over the period 2021/22 to 2023/24, the average DIS score of an student in receipt of a Student Universal Support Ireland (SUSI) grant was -1.3, this was compared to the average DIS score of 3.2 for students not in receipt of SUSI. Thus, students in receipt of a SUSI grant are more disadvantaged than students who are not in receipt of a SUSI grant. Overall the average DIS score for all students was 2.0.
50% of students who received SUSI grants were in the Disadvantaged or Marginally Below Average groupings (16% Disadvantaged, 34% Marginally Below Average), in comparison to 31% of students who do not receive a SUSI grant (7% Disadvantaged, 24% Marginally Below average).
9% of SUSI grant recipients had a home address in an Affluent area, this is compared to 21% of non-grant recipients and 16% of students overall. Note that the Deprivation Index Scores are assigned by home address; disadvantaged students can reside in affluent areas, and vice versa. For more information on the HP Deprivation Index Score, see here.
Between 2021/22 to 2023/24, the DIS breakdown between Undergraduate New Entrants who completed the Access Survey and reported having a disability for and those that reported not having a disability was very similar. Students who responded “Yes” had a DIS average score of 1.7 versus 1.6 for those who responded “No”. The breakdown by group across Yes/No was very similar the largest difference was between Affluent students (Yes 18% No 16%).
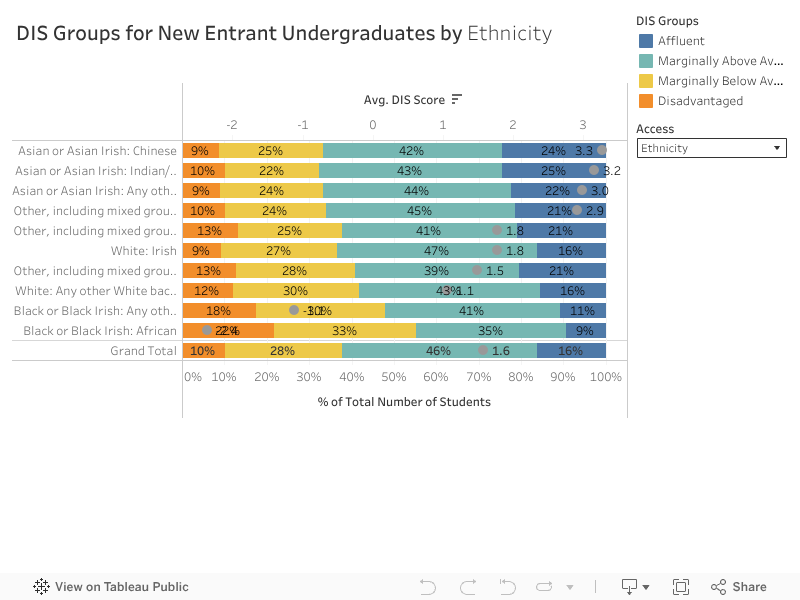
when reviewing by Ethnicity, the Ethnicity with the highest average DIS Score was Asian or Asian Irish: Chinese, with an average DIS Score of 3.3. Within this group 24% of students had an Affluent home addresses. The second most affluent group was Asian or Asian Irish: Indian/Pakistani/Bangladeshi, with an average DIS Score of 3.2 with 25% of Students being Affluent.
In contrast, Black or Black Irish: African, had the lowest average DIS Score at -2.4, with 22% of students coming from a Disadvantaged area. This was followed by Black or Black Irish: Any other Black Background, with an average DIS Score of -1.1, with 18% coming from a Disadvantaged background.
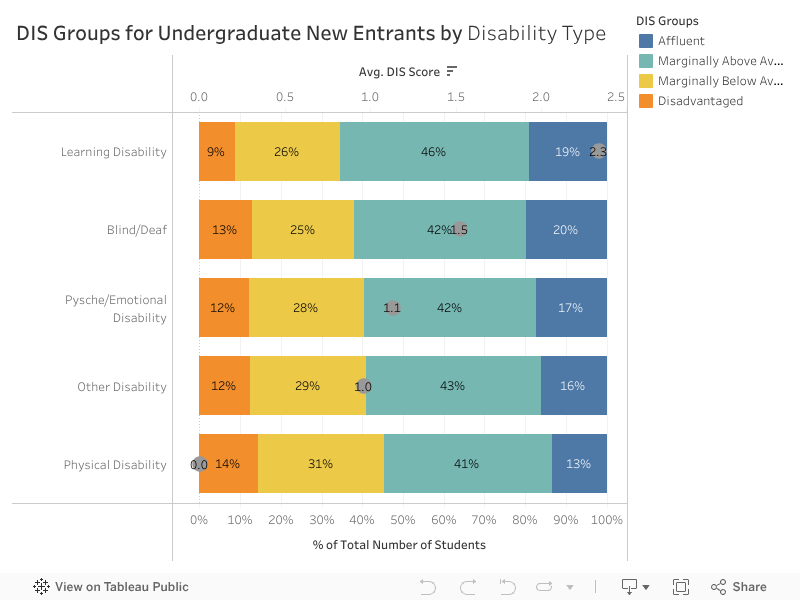
Across the period 2021/22 to 2023/24, of the disability categories on the Access Survey students who report a learning disability had the highest average DIS Score at 2.3 65% of these students were from a Marginally Above Average or Affluent area (19% Affluent and 46% Marginally Above Average). This was followed by Blind/Deaf students who had an average DIS Score of 1.5
In contrast students who reported a Physical Disability had the lowest average DIS Score at 0.0. 45% of these students were from a Marginally Below Average or Disadvantaged background (14% Disadvantaged and 31% Marginally Below Average). This was followed by Other Category with an average DIS Score of 1.0.